Broad Stock Market Outlook for February 22, 2018
Price resistance stood tall yesterday and rejected the bulls advance. This lead to a very swift move to lower price support from last Thursday. As I mentioned yesterday, big spikes in either direction for stock market futures will likely be reversed but these lower highs and lower lows are hinting at diminishing strength.
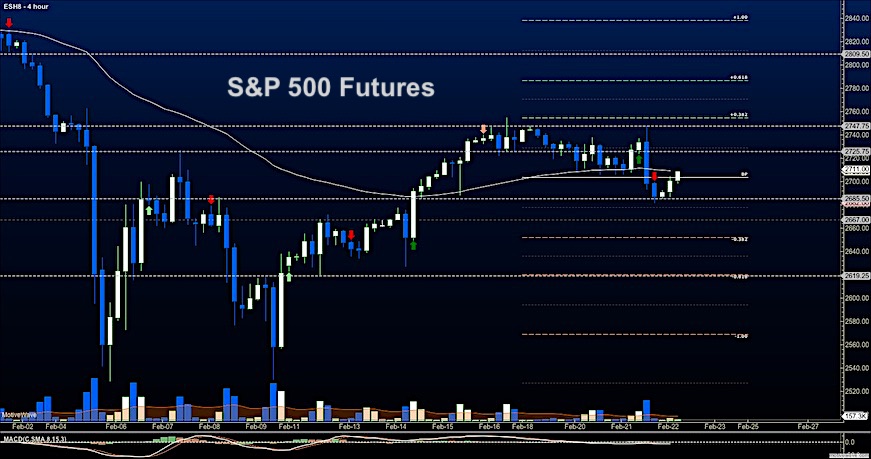
A key price region on the S&P 500 for buyers to breach and hold today will be 2705 in mixed momentum.
S&P 500 Futures
Overhead price resistance is lower once again near 2729. Our pattern continues to weaken its bullish form in the short term. Failure to break and hold above 2736 will bode poorly for recovery. Keep your eyes open for a failure to test higher highs, or for the break of lower support near 2686 as this will signal more strengthening from the sellers. The bullets below represent the likely shift of trading momentum at the positive or failed retests at the levels noted.
- Buying pressure intraday will likely strengthen with a positive retest of 2732.5
- Selling pressure intraday will likely strengthen with a failed retest of 2686
- Resistance sits near 2717 to 2729.5, with 2747.5 and 2756 above that.
- Support sits between 2700.5 and 2692.25, with 2682.25 and 2672.5 below that.
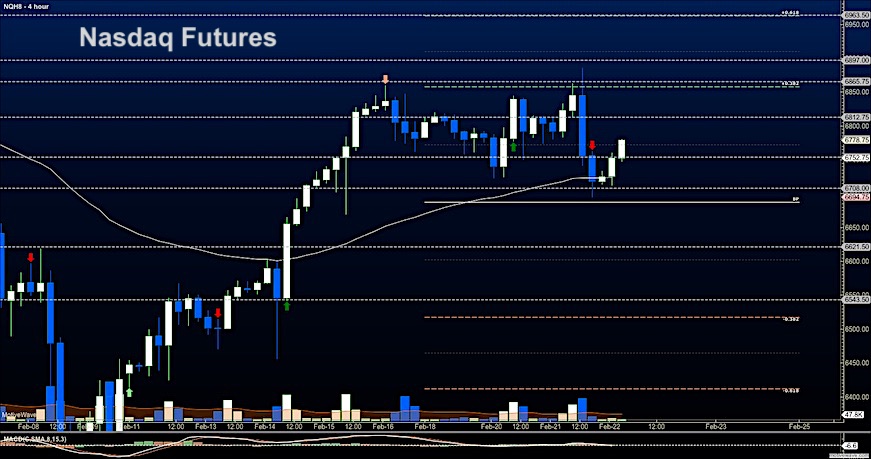
NASDAQ Futures
Momentum remains mixed with higher near-term highs and lower near-term lower lows. The bullish trend remains intact in general, but weakness continues to show through. The bullets below represent the likely shift of intraday trading momentum at the positive or failed tests at the levels noted.
- Buying pressure intraday will likely strengthen with a positive retest of 6784.5
- Selling pressure intraday will likely strengthen with a failed retest of 6751
- Resistance sits near 6778 to 6802.25 with 6841.5 and 6888.5 above that.
- Support sits between 6756.5 and 6736.5, with 6708.5 and 6659.5 below that.
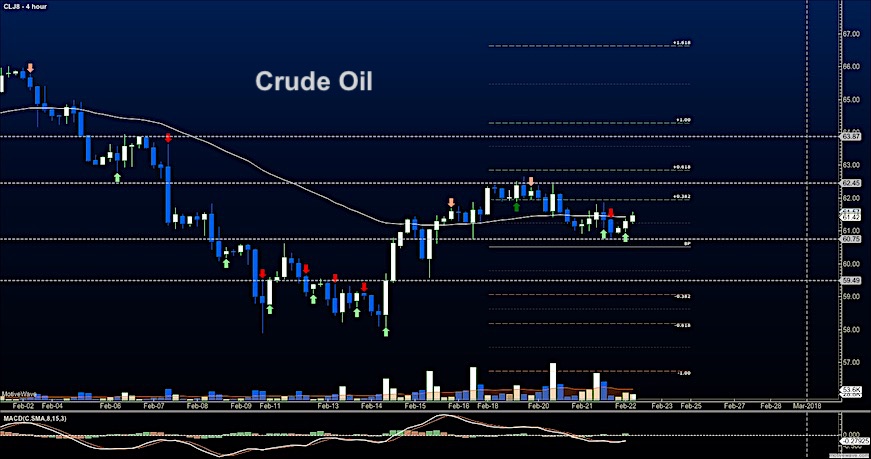
WTI Crude Oil
Mixed momentum continues in WTI as well but there is a rise in momentum from beneath. Support holds at 60.75 and resistance is lower in a squeeze of price into the EIA report today. The bullets below represent the likely shift of intraday trading momentum at the positive or failed tests at the levels noted.
- Buying pressure intraday will likely strengthen with a positive retest of 62.25
- Selling pressure intraday will strengthen with a failed retest of 61.16
- Resistance sits near 61.74 to 62.02, with 62.38 and 62.68 above that.
- Support holds near 61.16 to 60.76, with 60.17 and 59.64 below that.
Twitter: @AnneMarieTrades
The author trades stock market futures every day and may have a position in mentioned securities at the time of publication. Any opinions expressed herein are solely those of the author, and do not in any way represent the views or opinions of any other person or entity.


