This week the market is giving investors a lesson about Risk Management and psychology.
Current sentiment polls show the public is at “all in” levels, which indicates a Euphoric State of market mind taking over.
Careful here.
A Look Inside The Semiconductor’s with $SOXX and $SMH ETFs.
If investors want to know where the market is headed next, a good place to start is with the Semiconductor’s in the Technology Sector. They have been a market leader, and therefore, where they go next is of interest to investors. More specifically, we’ll look at two popular ETFs: The VanEck Vectors Semiconductor (SMH) and The iShares PHLX Semiconductor ETF (SOXX).
The SOXX ETF is comprised of holdings in the U.S., Emerging and Developed Markets whereas SMH, tracks the performance of 25 of the largest semiconductor companies with a US Stock focus and exposure from giant, large and mid-cap sized companies.
The main difference in the two ETFs is that the SOXX dedicates the majority of its assets to medium and large cap funds, which brings more volatility than a traditional large cap fund.
TECHNICALS IN THE ANALYSIS
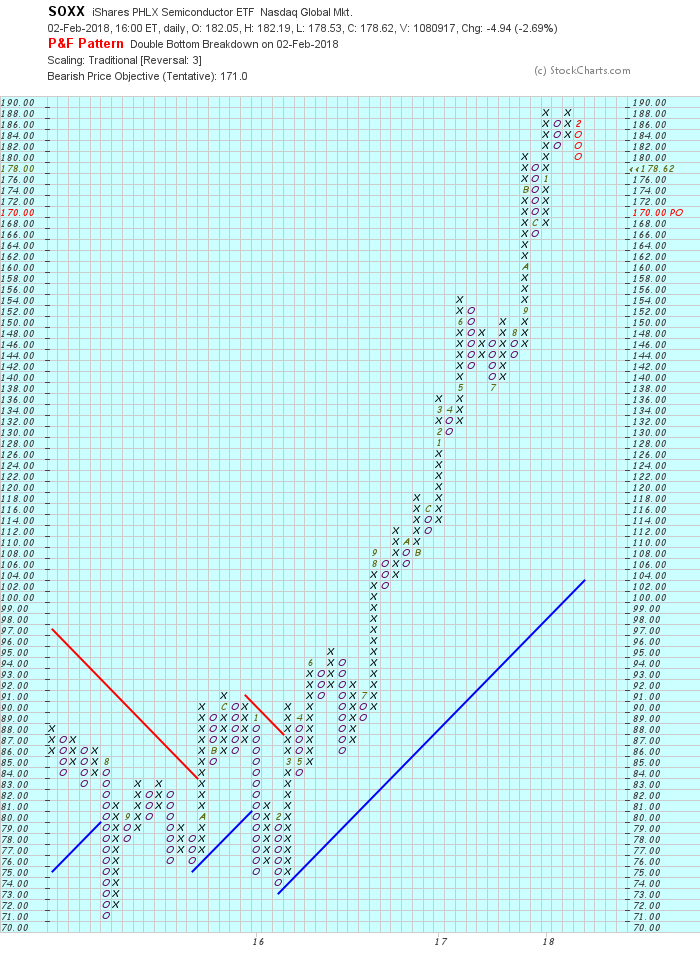
$SOXX Point & Figure on 2-2-2018
- Strike #1: The Daily Point and Figure Chart had a Double Bottom breakdown on Feb. 2nd with a bearish objective of $170. This is an important number. Why?
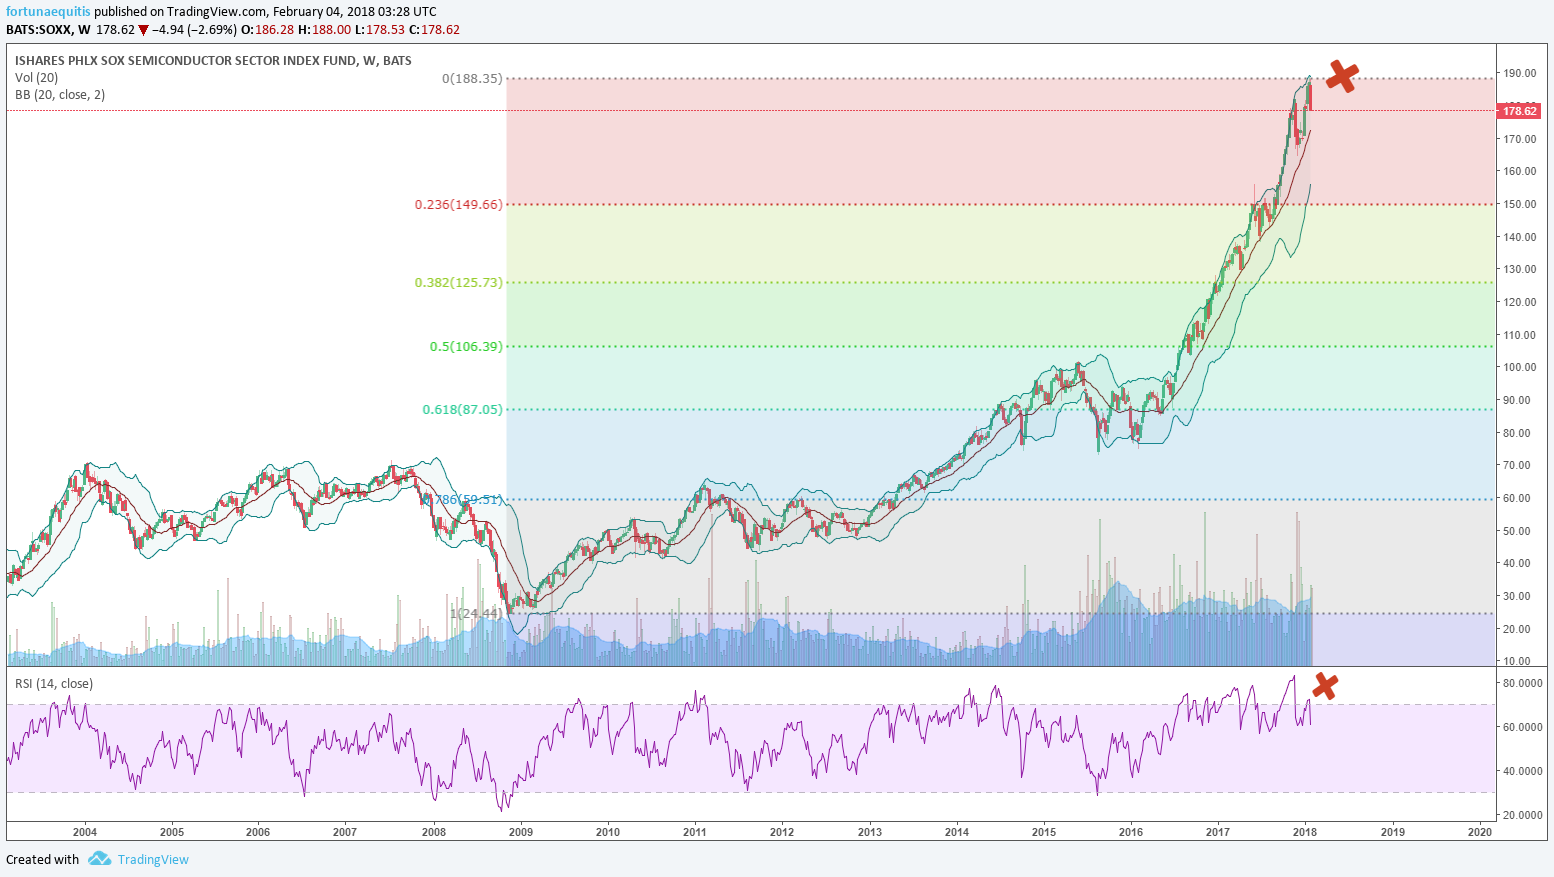
Now let’s take a look at the Weekly “closing” stock chart… and in particular the Red X.
Some takeaways:
- The Red X is Strike #2. Price hit the top of the Bollinger Band
- The Point and Figure price target of $170 is right at the mid-point (red line in between the bands) This is where we would watch to see a bounce once price falls, if not, it’s to the bottom of the band more than likely.
- RED X in RSI is Strike #3. It’s clearly bearish and been so since early 2017. It was way, way, way overbought.
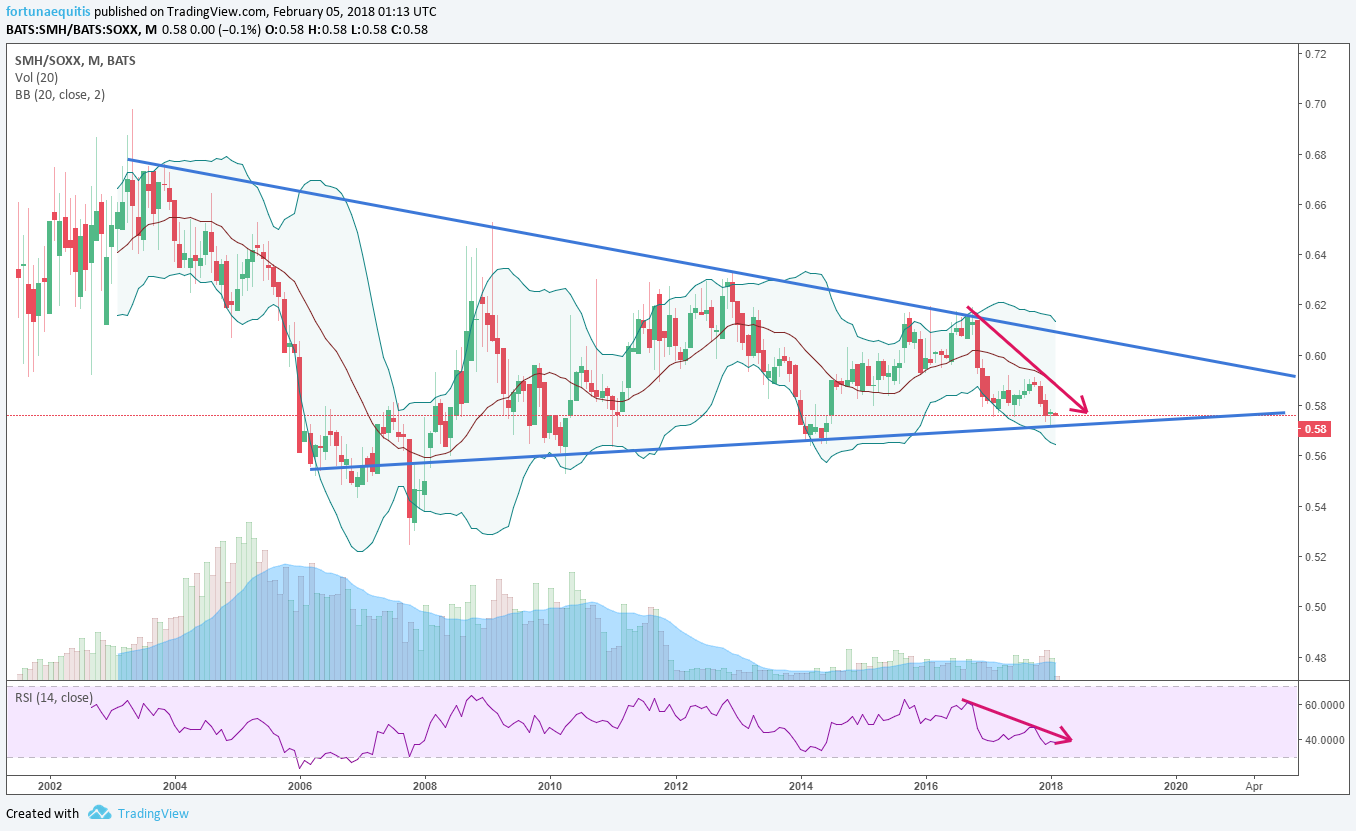
$SMH TECHNICALS
Not much better for the majority of these are Large caps. This too will continue to erode with negative bearish patterns for the time being. Point and Figure price objective of $72 had been met from the Ascending Triple Top Breakout mid-January.
Very negative outlook based upon the patterns for the following reasons:
- The $SMH entered the triangle pattern negatively (in a downtrend).
- RSI (Momo) has dropped and selling accelerated as soon as price hit the top of the Triangle pattern that is a bearish coiling till support is broken or there is a surprise reversal. (Don’t get too excited about that probability till we see signs of it. There are none yet.)
- This looks poised to coil down quickly and break the bottom triangle support and underperform the $SOXX. Look out below. $SMH is in sell off mode. This week the market confirms the mood.
Top Holdings in $SMH:
$TSM, $INTC, $NVDA, $ASML, $TXN, $QCOM, $AMAT, $MCHP, $NXPI, $ADI, $AVGO, $MU, $LRCX, $SWKS
One more comparison chart. But in an Anagram.
Normally the comparison would be $NASX vs $SOXX, instead the picture is clearer in the mirror image.
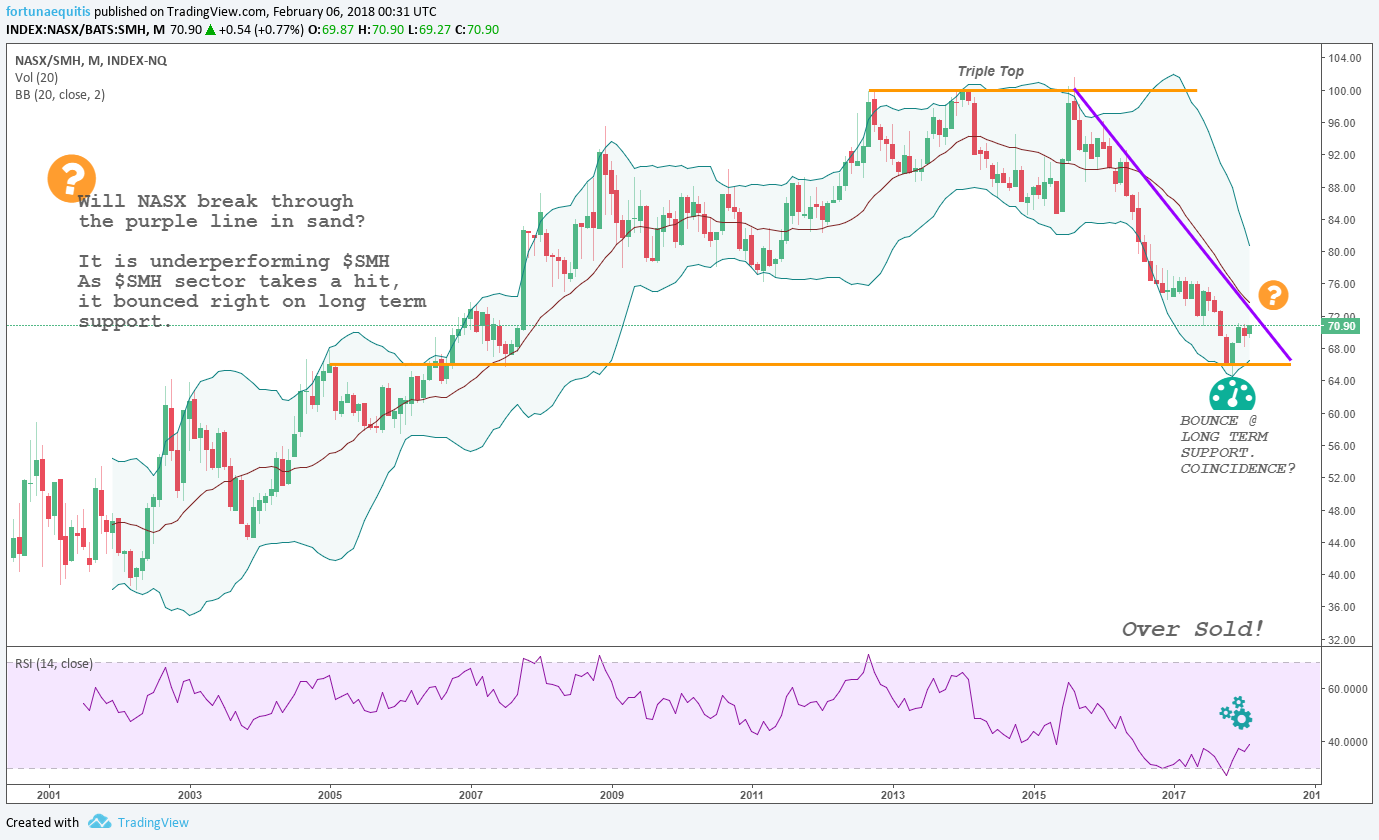
This is the Monthly and the big question on 2-6 was if $NASX will break through the purple line in the sand. $NASX is underperforming the semiconductor ETF $SMH and recently when the $SMH took the hit, the $NASX bounced right on long term support.
The RSI shows $NASX as oversold and having some recent bullish momentum; suggesting a rotation may be in play. The caveat is in the weekly candle, so let’s look at this weeks close because we know we are selling off now, and also that stocks can be oversold for quite some time. Before we get bullish on $NASX we’ll need to see more positive messages in bottles.
Get in touch if you need assistance for your advisory, We help financial professionals wanting to improve their own Risk Management and gain downside protection, better entries and exits and in depth research with or without a quantitative overlay.
Hope this helps you gain some perspective and protection.
If you are interested in learning more about our investing approach and financial services, visit us at CaptainJohnCharts.
Twitter: @CptJohnCharts & @FortunaEquitis
The author may have a position in mentioned securities at the time of publication. Any opinions expressed herein are solely those of the author, and do not in any way represent the views or opinions of any other person or entity.


 Vying For Stock Market Leadership Role")


 Nears Important Pivot Point")