THE BIG PICTURE – What’s Ahead?
The major stock market indices closed lower than the weekly open. We did see strong trending sessions 4/5 days to close out the books on Q2 and week 26.
That said, the volatile price action mid-week made it extremely difficult to hang on for the ride down (a weekly recap which may be found here). The Nasdaq (INDEXNASDAQ:.IXIC) lead the way lower, followed by the S&P 500 (INDEXSP:.INX) and Dow Jones Industrials (INDEXDJX:.DJI).
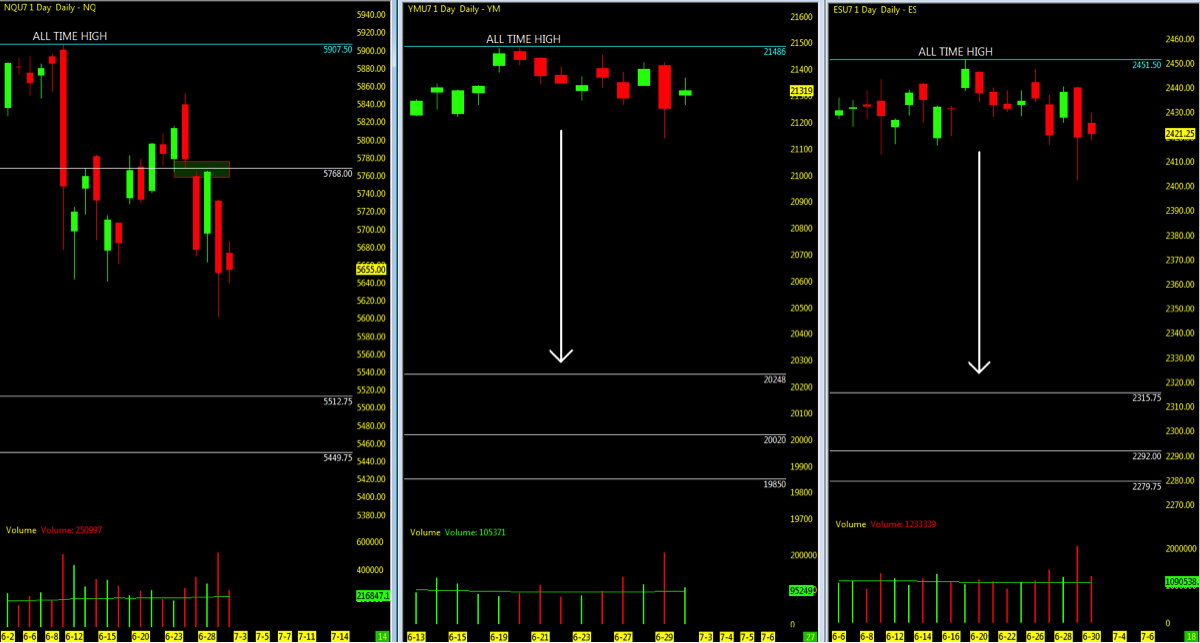
VIX levels spiked higher but ended the week in the 10-11 range. Volume hasn’t been to bad as we roll into Q3 and earnings season for the next 6 weeks. Watch for the permabears beating their drum of the doom and gloom that lies ahead.
FANG/FAAMG stocks remain steady as the YM/ES remain consolidated. NQ all over the place and losing it’s relentless drive upside. Overall JUNE economic data not as strong as we wish it to be, needs to pick up significantly in conjunction with good earnings for Q2. Combined with summer momentum, the probability of a pullback seems to be building.
Technically, the market indices open gaps remain below and viable targets for a pullback on all three. The ES/YM further downside may be the summer targets as price action wallows around the key moving averages and appears to be losing its hold on the NQ. As always be ready for both directions in the unpredictable market.
Key events in the market this week include Q3 start, FOMC minutes, ADP, non-farm Payrolls and earnings season approaching.
THE BOTTOM LINE
Overall looking for a summer pullback/correction and then regain traction back upside.
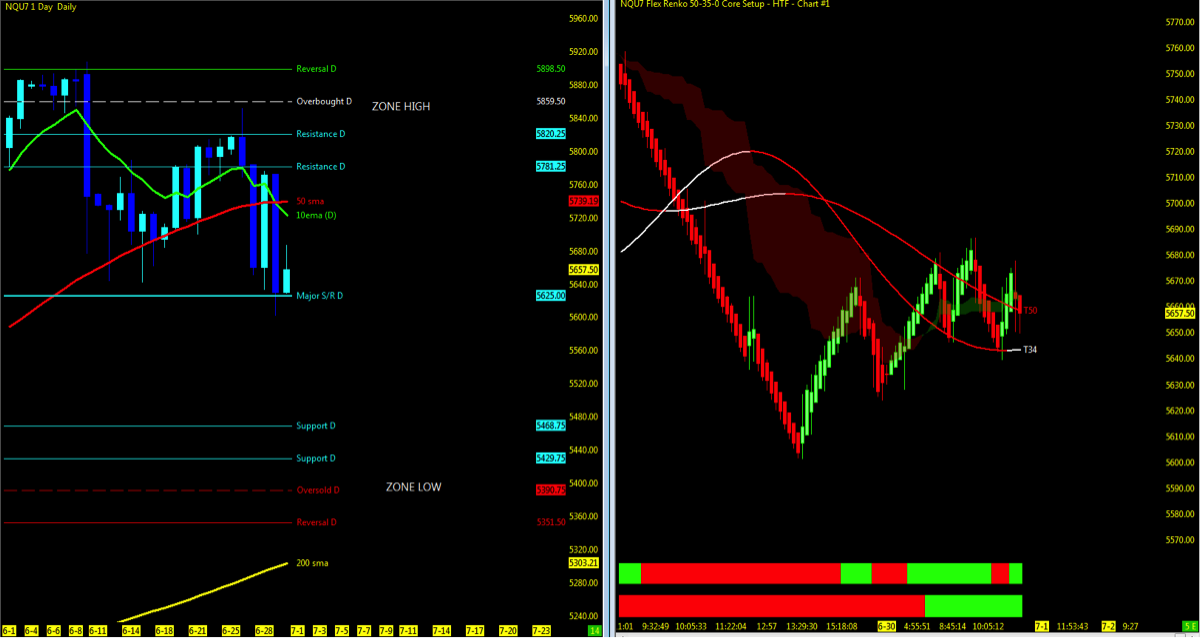
Nasdaq futures (NQ) are losing support at the 10/50ema and sitting at @ the 50% Daily MML with two immediate open gaps below – watch for the MML zone low support and 200ma. Bulls need momentum to pick up to regain the 10 day ema and close out open gap upside.
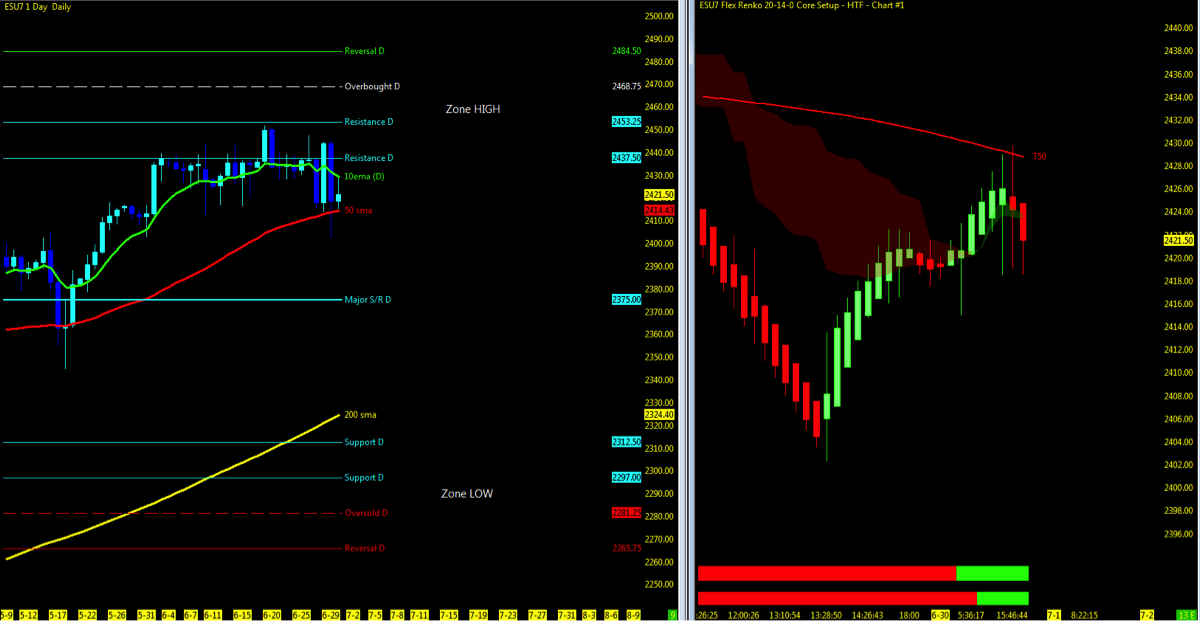
S&P 500 (ES) and Dow Jones futures (YM) maintain momentum upside and remain in consolidation around the 10/50 period moving averages. A deeper pullback on the ES will retest 50% MML and lower to the 200ma. YM look for support downside at the 50. Momentum upside look to the highs on the breakout back to all time highs.
Attempting to determine which way a market will go on any given day is merely a guess in which some will get it right and some will get it wrong. Being prepared in either direction intraday for the strongest probable trend is by plotting your longer term charts and utilizing an indicator of choice on the lower time frame to identify the setup and remaining in the trade that much longer. Any chart posted here is merely a snapshot of current technical momentum and not indicative of where price may lead forward.
NQ – Nasdaq Futures
Technical Momentum: UPTREND Pullback
Using the Murray Math Level (MML) charts on higher time frames can be a useful market internal tool as price action moves amongst fractal levels from hourly to daily charts. Confluence of levels may be levels of support/resistance or opportunities for a breakout move.
Multiple MML Overlay (4hr with 60m/Daily/Weekly and Range)
- Lowest Open Gap: 4017
ES – S&P Futures
Technical Momentum: UPTREND CONSOLIDATION
Multiple MML Overlay (4hr with 60m/Daily/Weekly and Range)
- Lowest Open Gap: 1860.75
Thanks for reading and remember to always use a stop at/around key technical trend levels.
Twitter: @TradingFibz
The author trades futures intraday and may have a position in the mentioned securities at the time of publication. Any opinions expressed herein are solely those of the author, and do not in any way represent the views or opinions of any other person or entity.

: Creating Bullish Divergence?")

: Creating Bullish Divergence?")


