Stock Market Futures Trading Considerations For April 19, 2017
The S&P 500 Index (INDEXSP:.INX) held support in a battle against longer time frames – this shows that our range still remains intact. Key levels to watch are in the trading section on ES. Gold and the 30-year bonds have been running ahead of themselves so a bit of a fade is in progress, but still holding bullish formations.
Check out today’s economic calendar with a full rundown of releases. And note that the charts below are from our premium service at The Trading Book and are shared exclusively with See It Market readers.
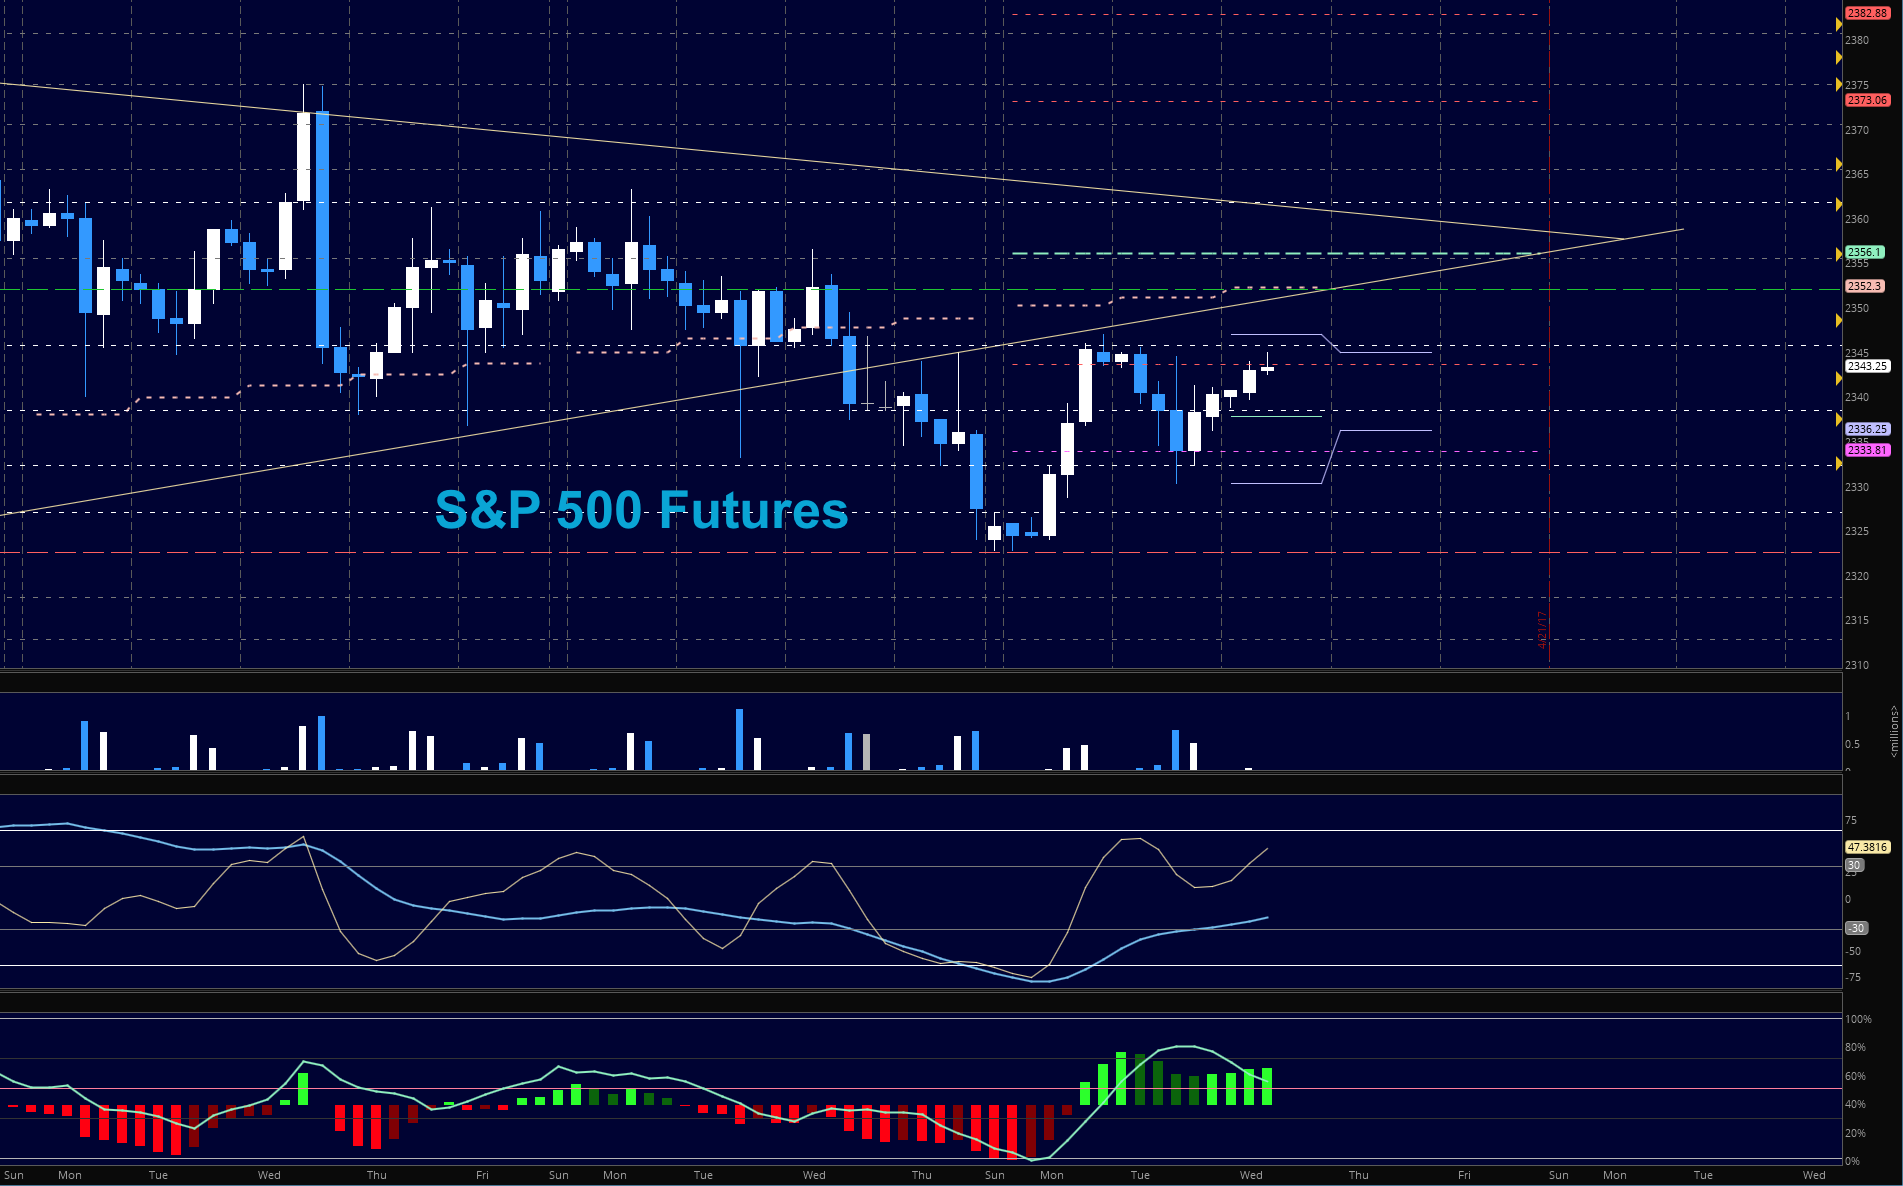
S&P 500 Futures (ES)
For the fourth day, we are testing 2345 as resistance and making higher lows at the same time. This is a pivotal region around 2338.5 that traders are coiling around with no real resolution as of yet. Caution all the way around is suggested with divergent action. Levels remain the same as yesterday in terms of pressure.
- Buying pressure will likely strengthen above a positive retest of 2354.5
- Selling pressure will likely strengthen with a failed retest of 2334
- Resistance sits near 2346.5 to 2354.5, with 2357.5 and 2361.25 above that
- Support holds between 2334 and 2322.5, with 2317.75 and 2305.5 below that
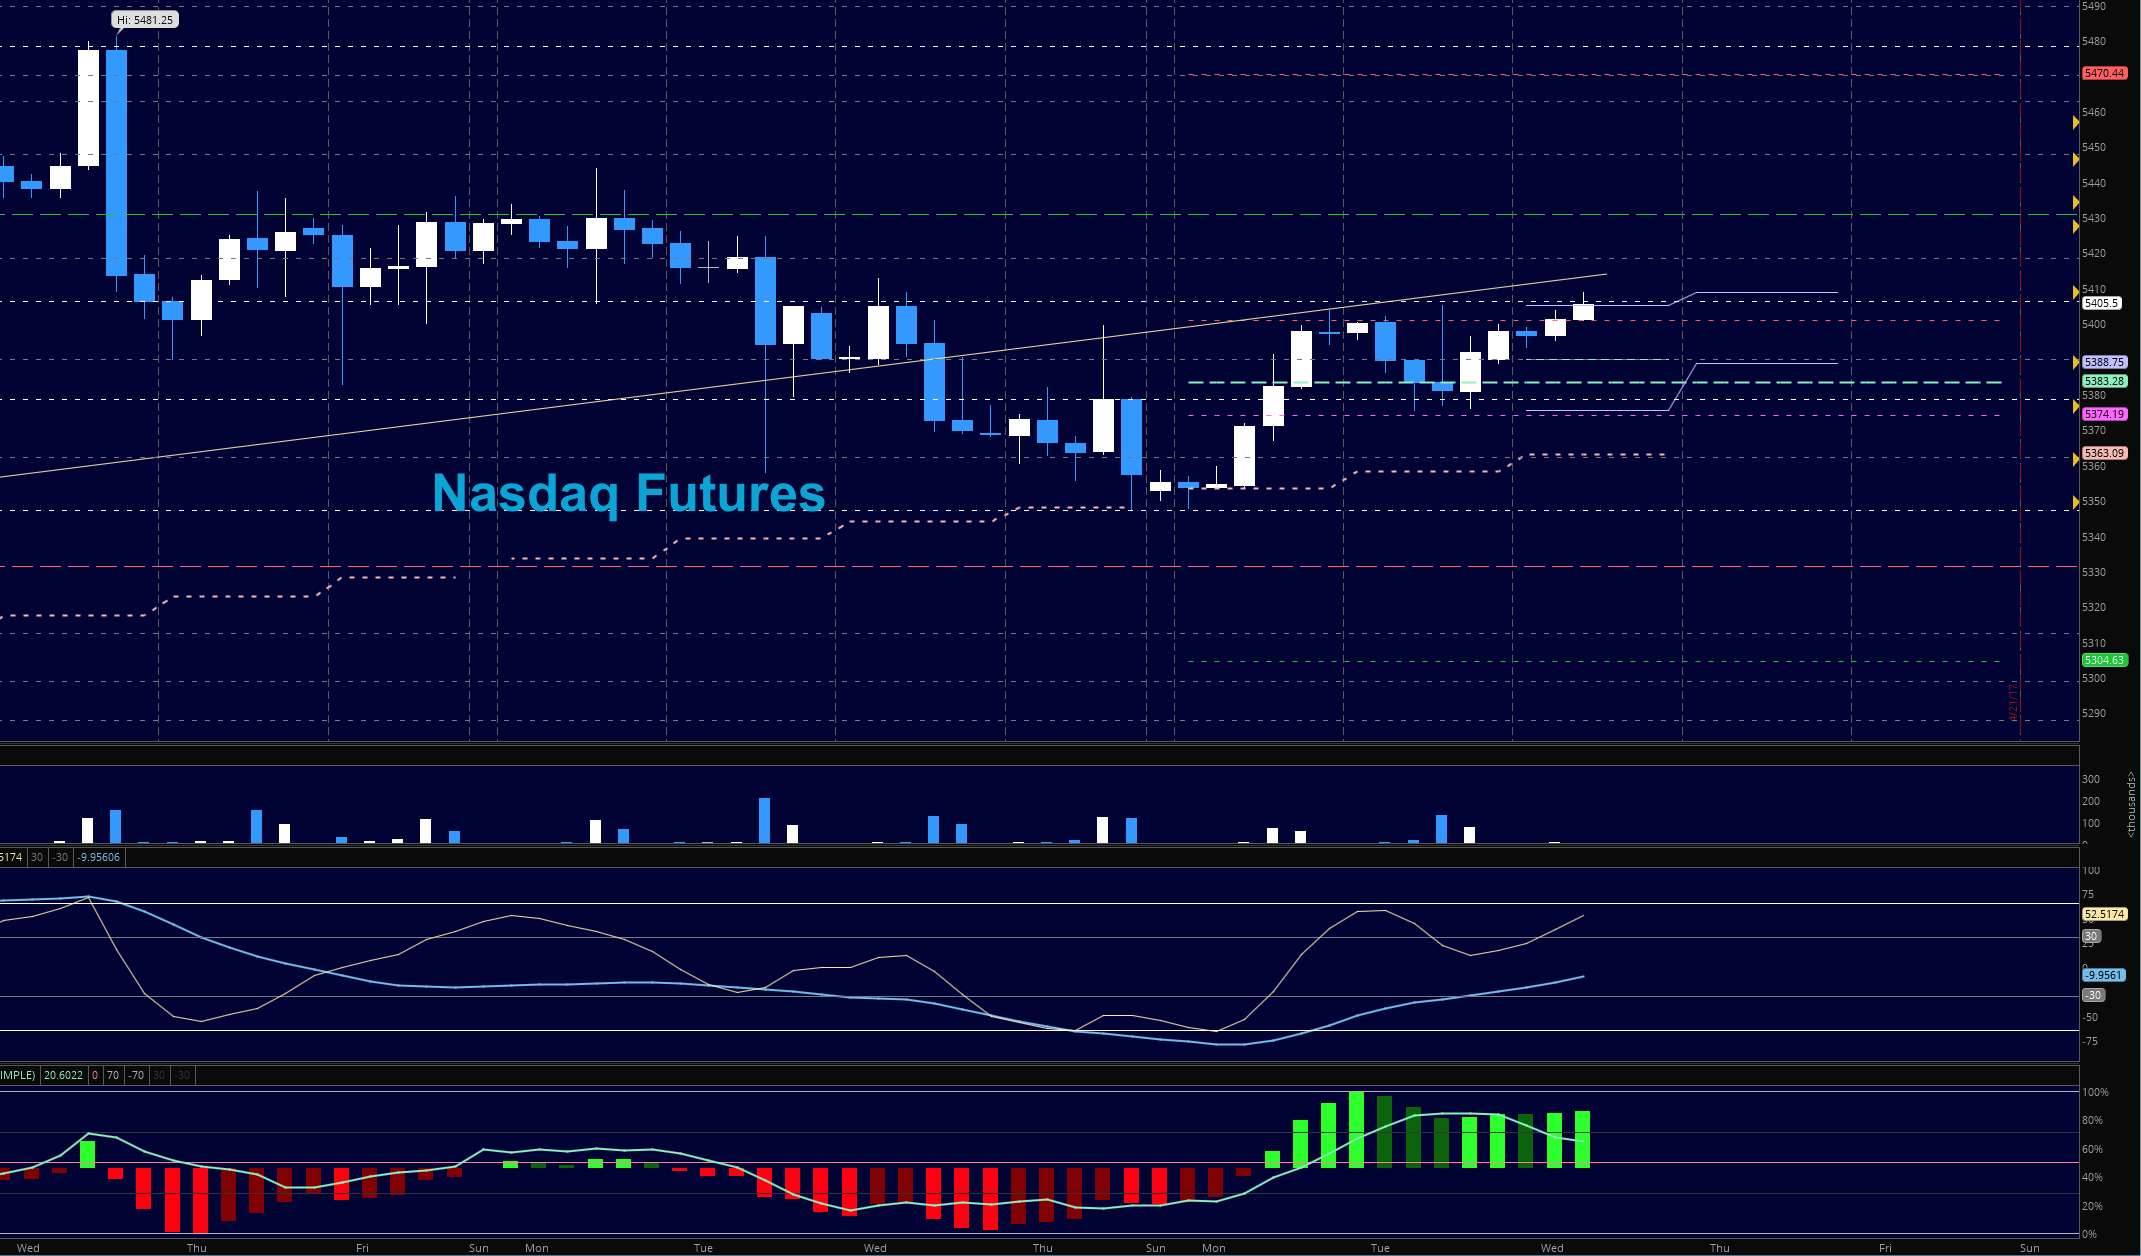
NASDAQ Futures
NQ_F- Traders resolved the bounce upward into important resistance near 5405 for the third day as higher lows build with converging short term momentum. We’ve got a mixed bag so reversals are likely at the edges – but the spikes higher or dips lower could be bigger than expected if we continue to see momentum algorithms join the fray. Choppy markets with wider swings are the order of the day once again – though the NQ_F could see bigger bounces. Support is building at 5374. Above the region, we should have buyers in charge and below the region, sellers will hold the power. Level to level trading is best here and preparing for both the entry and exit.
- Buying pressure will likely strengthen with a positive retest of 5406.5 (use caution as sellers sit near 5413)
- Selling pressure will likely strengthen with a failed retest of 5374.25
- Resistance sits near 5406.5 to 5412.75, with 5417.75 and 5434.5 above that
- Support holds between 5374.25 and 5358.25, with 5347.5 and 5331.5 below that
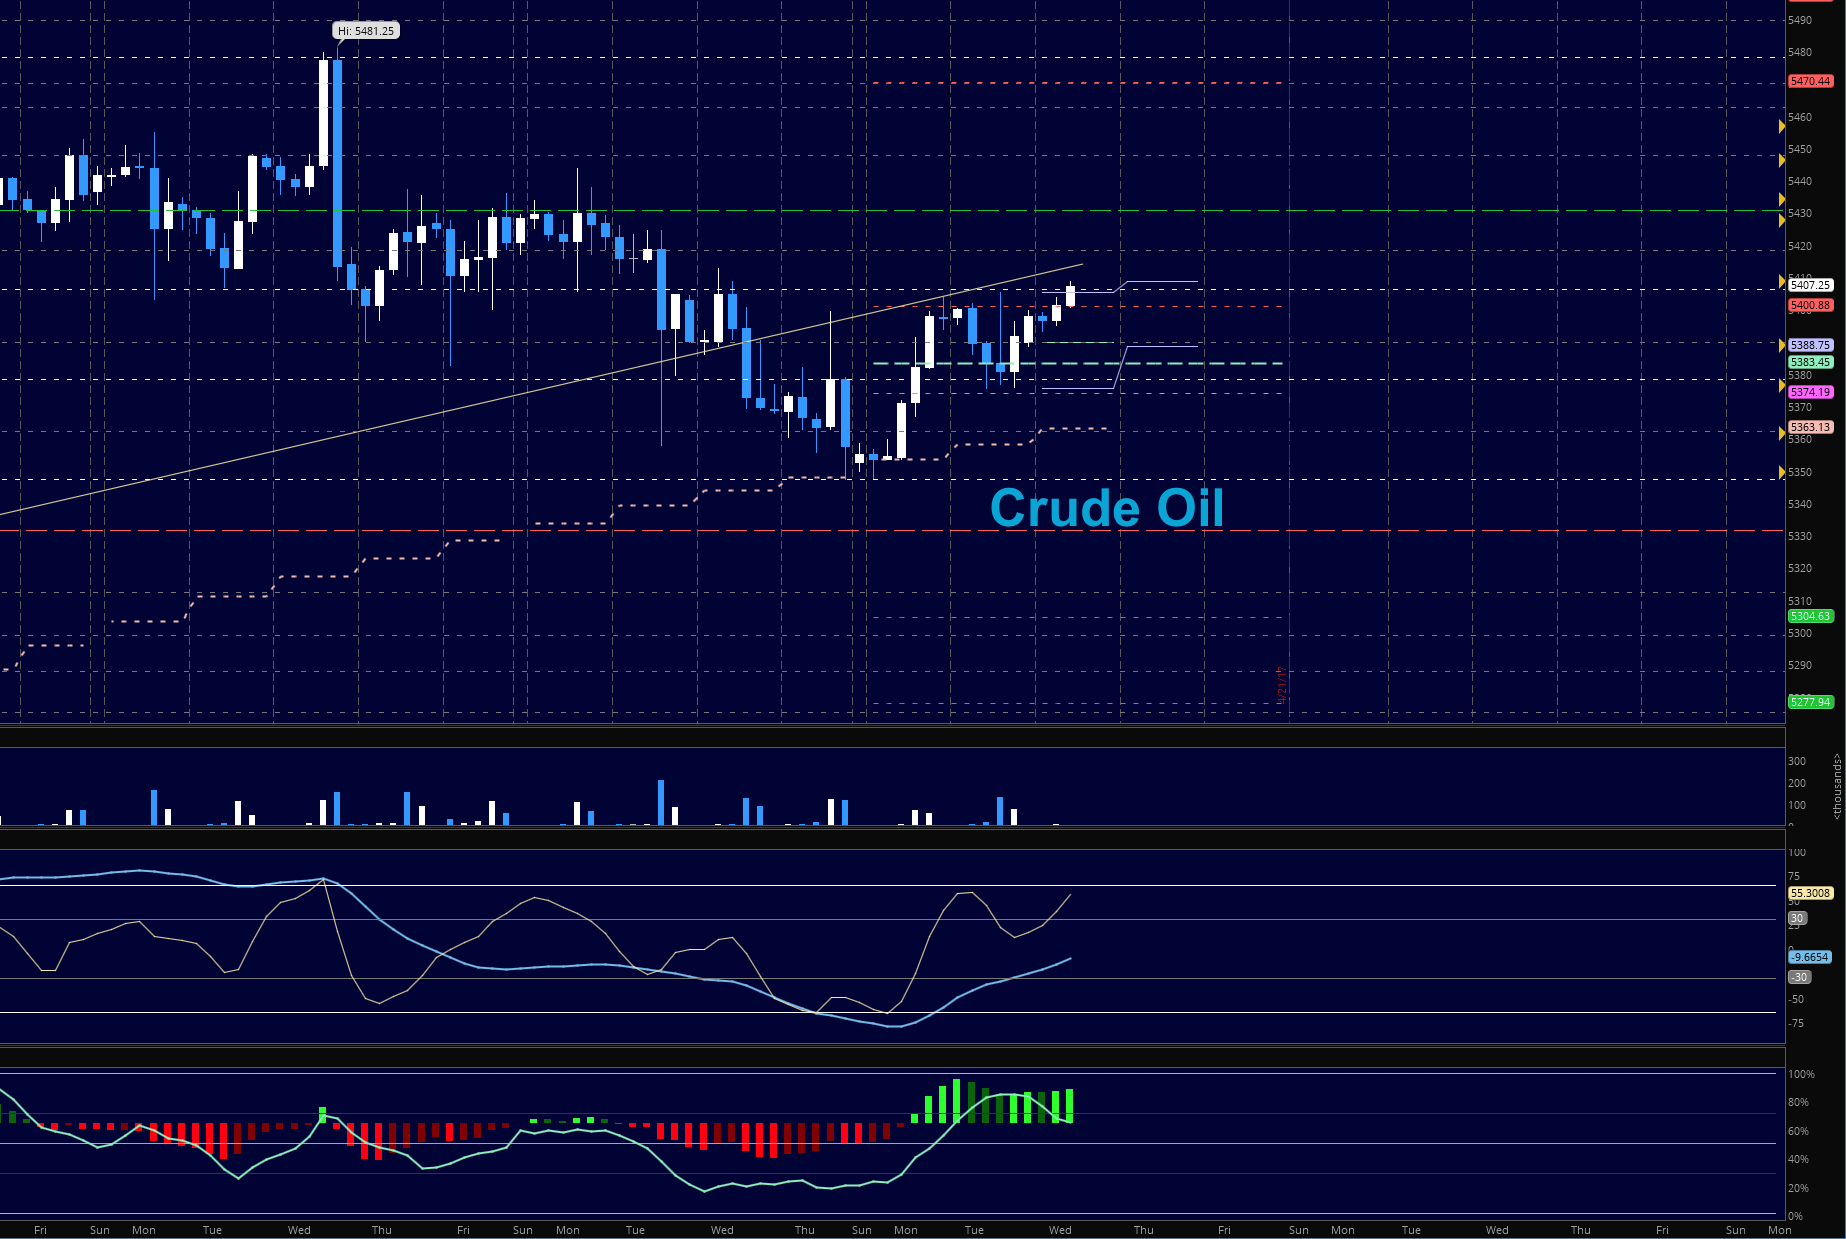
Crude Oil –WTI
With the API report behind us and the EIA ahead at 1030 ET, oil sits in a sideways pattern. Resistance sits ahead at 53.11 and a breach here will bring us to a breakout space. Oil remains in tight formations as rebalancing continues with momentum suggesting that support tests will hold. Price action remains very choppy with sellers sitting near 53.2 and buyers near 52.63 as it was yesterday.
- Buying pressure will likely strengthen with a positive retest of 53.14
- Selling pressure will strengthen with a failed retest of 52.5
- Resistance sits near 53.36 to 53.78, with 54.11 and 54.53 above that.
- Support holds between 52.52 and 52.2, with 51.69 and 50.88 below that.
Our live trading room is now primarily stock market futures content, though we do track heavily traded stocks and their likely daily trajectories as well – we begin at 9am with a morning report and likely chart movements along with trade setups for the day.
As long as the trader keeps himself aware of support and resistance levels, risk can be very adequately managed to play in either direction as bottom picking remains a behavior pattern that is developing with value buyers and speculative traders.
Twitter: @AnneMarieTrades
The author trades stock market futures every day and may have a position in mentioned securities at the time of publication. Any opinions expressed herein are solely those of the author, and do not in any way represent the views or opinions of any other person or entity.


