The following is a recap of the October 21 COT Report (Commitment Of Traders) released by the CFTC (Commodity Futures Trading Commission) looking at COT data and futures positions of non-commercial holdings as of October 18.
Note that the change in COT report data is week-over-week. Excerpts of this blog post originally appeared on Paban’s blog.
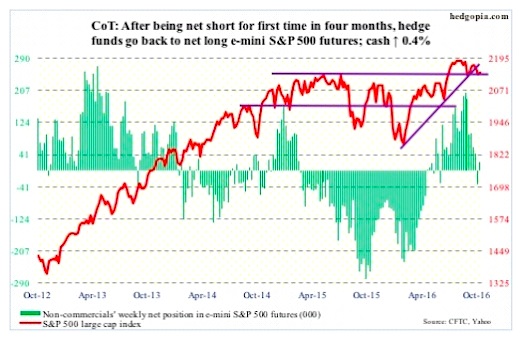
E-mini S&P 500
The 2120 support in the S&P 500 Index (INDEXSP:.INX) was tested again this week and held. But equity bulls were unable to fully take advantage of the daily oversold conditions.
Flows continue to be a problem. In the week ended Wednesday the SPDR S&P 500 ETF (NYSEARCA:SPY), lost $206 million. In the prior week, outflows were $1.8 billion (courtesy of ETF.com).
In the same week, another $3.4 billion came out of U.S.-based equity funds (courtesy of Lipper). The S&P 500 peaked at 2193.81 on August 15; since the week ended August 17, north of $40 billion has left these funds.
October 21 COT Report data: Currently net long 23k, up 56.9k.
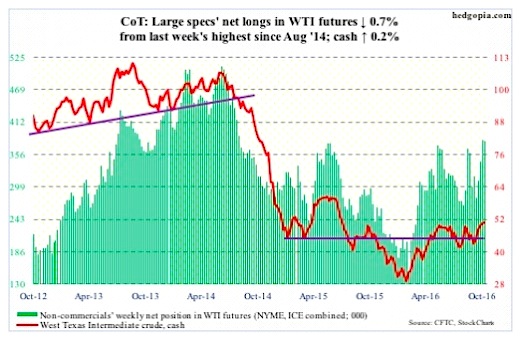
Crude Oil
This time of the year, it is normal for U.S. crude oil inventory to build. Refineries go into maintenance, producing less fuel products. In the week through October 14, refinery utilization did indeed drop five-tenths of a point, to 85 percent – the lowest since April 26, 2013.
Distillate stocks fell too, by 1.2 million barrels to 155.6 million barrels – a seven-week low. But gasoline stocks rose, by 2.5 million barrels to 228 million barrels – a five-week high.
The surprise of all, crude oil stocks fell by 5.2 million barrels to 468.7 million barrels. This was the lowest since January 22 this year. Crude stocks have dropped by 26.5 million barrels in the last seven weeks, and refinery utilization by 8.5 percentage points in the last six.
Perhaps contributing to the large weekly drop in crude stocks was crude oil imports, which fell a whopping 954,000 barrels per day to 6.9 million b/d – the lowest since June 19, 2015.
Production rose a tad, by 14,000 b/d to 8.5 mb/d. Oil production peaked at 9.61 mb/d in the June 5th week last year.
Traders on Wednesday decided to focus on the drop in crude stocks/imports not the increase in gasoline stocks. Spot West Texas Intermediate crude oil prices rallied 2.4 percent in that session, past the June 9th high of $51.67/barrel. The SPDR energy ETF (NYSEARCA:XLE), tagged along, up 1.4 percent, but substantially off session highs.
Since February lows, spot WTI Crude Oil has been making higher lows, and would have been an interesting development should it convincingly push past the June 9th high for higher highs. The problem is, it has fatigue written all over, with a daily bearish MACD crossover.
October 21 COT Report data: Currently net long 378.5k, down 2.8k.
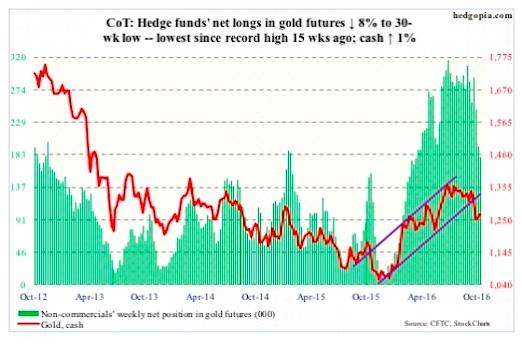
Gold
After five dojis in nine sessions around its 200-day moving average, the SPDR Gold ETF (NYSEARCA:GLD) rallied past the average on Wednesday, that too with a doji. The 200-day is still rising. But the 50-day is dropping – currently $1,312.2 on spot gold, 3.5 percent away. It is worth recalling that the 3.3-percent, October 4th drop in spot gold prices came in a session in which $1,300 support was lost – around where a tug of war is likely.
On a daily chart, spot gold prices just completed a bullish MACD crossover.
In the week ended Wednesday, $336 million moved into GLD. In the prior week, it attracted $455 million, (courtesy of ETF.com).
October 21 COT Report data: Currently net long 179.6k, down 15.6k.
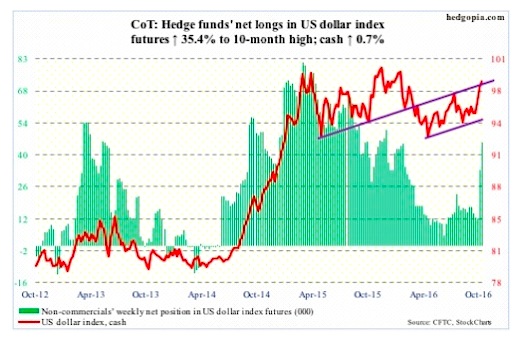
US Dollar Index
Non-commercials raised net longs to a 10-month high. Momentum is intact on the cash, with shorter-term averages still rising, and should continue to provide support near-term, even though daily momentum indicators are way overbought.
In a larger scheme of things, the spot continues to trade within $100-plus and $93-plus, with nice price action of late and a ‘higher lows, higher highs’ pattern.
October 21 COT Report data: Currently net long 45.4k, up 11.9k.
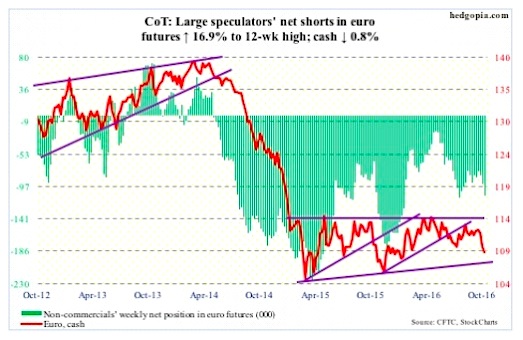
Euro
The ECB met Thursday, leaving interest rates unchanged. No change was expected. Consensus expects announcement of more stimulus in the December meeting. The current €80-billion/month program runs through March, or beyond, if necessary.
Post-meeting, Mario Draghi, ECB president, said that extension of the QE was not discussed at the meeting, but that the bank would continue to have substantial monetary policy support.
Not knowing how to react, the Euro whipsawed Thursday between 110.39 and 109.14, in the end closing down 0.4 percent to 109.28, followed by another 0.4-percent drop on Friday.
Last week, the Euro lost the November 2015 rising trend line. Since May this year, it has been making lower highs, and now has lower lows.
October 21 COT Report data: Currently net short 109.3k, up 15.8k.
Thanks for reading.
Twitter: @hedgopia
Author may hold a position in mentioned securities at the time of publication. Any opinions expressed herein are solely those of the author, and do not in any way represent the views or opinions of any other person or entity.


: Showing Some Signs of Emerging Strength")
