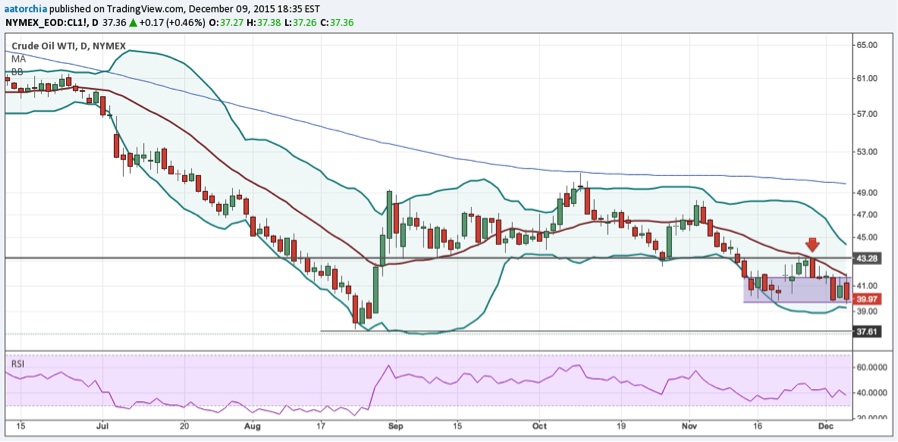
Today I am going to share a quick review of my crude oil trade that I entered on 11/12/15 and closed out on 12/8/15. Before my entry, it looked like crude put in a head and shoulders pattern. I am not so concerned about the head and shoulders pattern per say, more so with the 3 denials from a possible trend shift. If we broke potential support in the 43.25 zone, it was a high probability outcome that we could, at the minimum, re-test the previous low in the $38 zone.
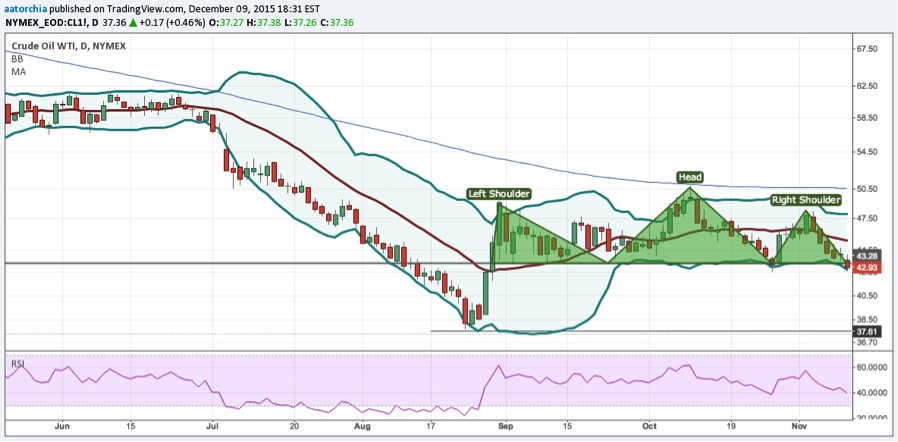
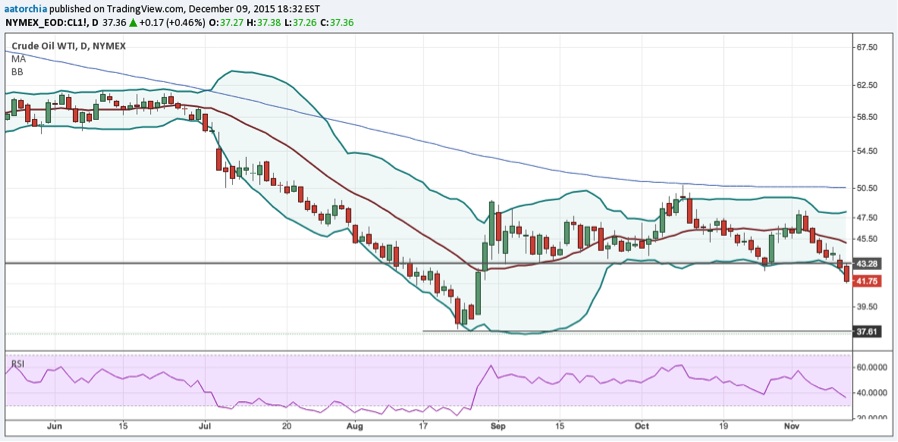
On 11/12/15, we firmly broke below the support zone of 43.25.
I entered my short crude oil trade via Proshares Ultrashort Crude Oil (SCO), positioning my stop where a close above 44 would stop me out for a loss.
In this market, trends have not been accommodating. I’m not saying they have to be, but I knew it would be wise to position with a relatively wide stop to give the trade a chance to work.
After we broke support, we began to consolidate in the 40-42 zone. This was promising as a consolidation after a break of support can usually signal a continuation. As we did not make a deeper move down, I was not in a rush to move my stop up on this crude oil trade.
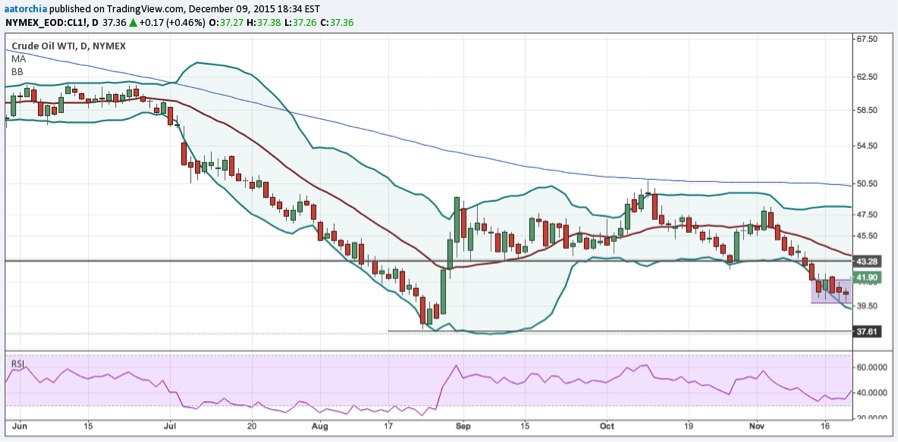
We began to rally off this consolidation zone and for a while I thought this trade may be invalid.
However, I had positioned so that I could withstand any of the noise of the market. We began to rally back up to broken support and then were immediately denied. Broken support held perfectly as resistance and the “short” crude oil trade was still in tact. Along with my trading style, keeping things simple is what usually works best. At this point I knew the trade was likely to be a good one.
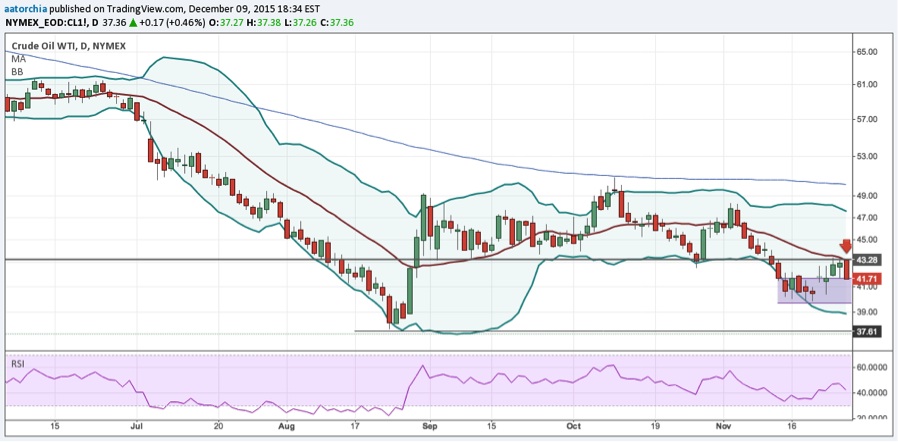
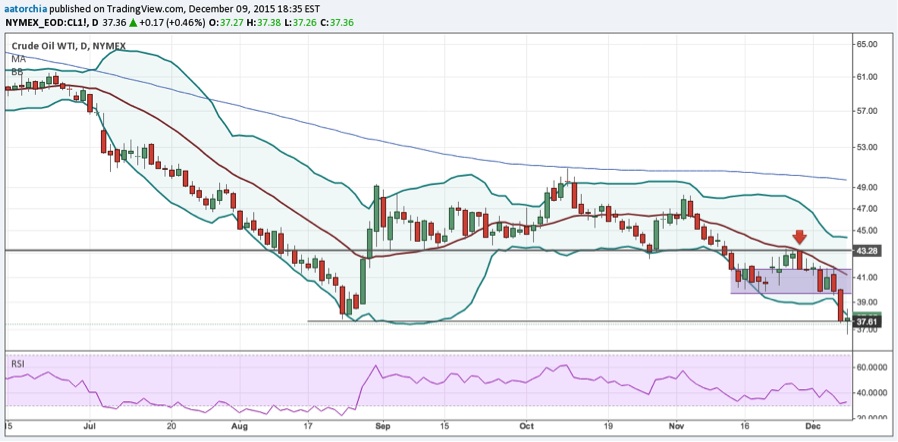
We quickly moved back down to the 40-42 potential support zone. At this point I was just waiting for the break and close of $40 to get the downside momentum going again.
Luckily, we flushed down to the $38 potential support zone in one day, all the way to my target. I was sitting in a very profitable trade and I decided it would be wise to take my gains upon the market forming a doji the following day.
The doji perfectly represented the indecision of market participants, would we flush the potential support zone at $38 and head even lower to the lows of 2008 around $33? Or would be squeeze shorts back up because of how crowded the trade is to the downside? I will let other market participants figure that one out.
Thanks for reading.
Twitter: @Johnny_Manzz
No position in the mentioned securities at the time of publication. Any opinions expressed herein are solely those of the author, and do not in any way represent the views or opinions of any other person or entity.


