A war in the Middle East can have significant and multifaceted impacts on the United States.
Typically, oil and gas would have the biggest impact with threats of supply disruptions.
However, the oil market, while higher from earlier in June, did not react to news of more Iranian bombing.
In fact, oil and gas both fell in price on Monday.
Financial market volatility, another by product of war, hit the markets at midday with volatility spiking. Nonetheless, the volatility died down soon thereafter.
Gold and silver expectedly gained on Monday, however, not as robustly as one might imagine.
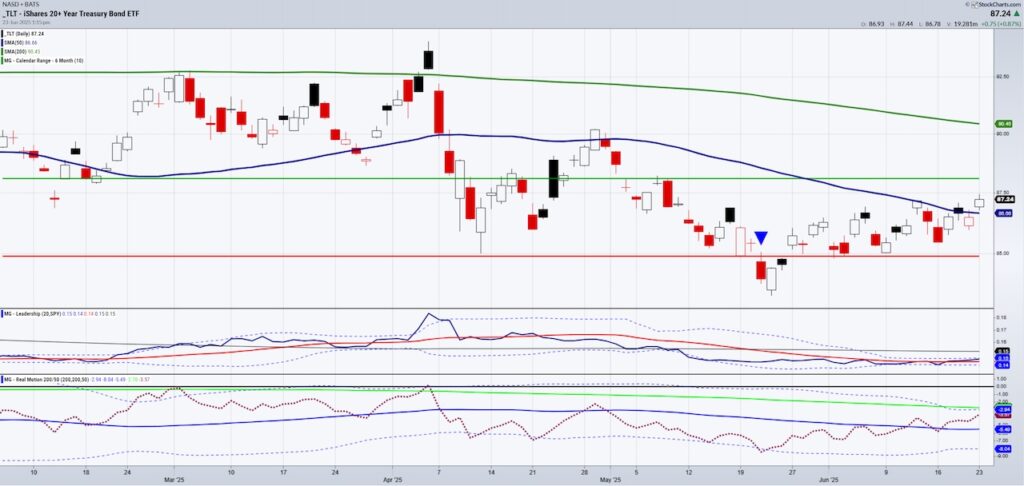
Long-dated 20+ year treasury bonds (NASDAQ: TLT) though, cleared the 50-Day Moving Average (DMA) for the second time since the end of April.
Back then, the rally did not last.
While treasury bond yields moved down Monday, and oil prices fell, it seems the best reason we can assume for the rally in the 20+ Year Treasury Bonds ETF (TLT) on Monday is the anticipation that central banks and perhaps our Federal Reserve will cut rates.
Full chart analysis:
Without an oil shock and fears of higher inflation, long bonds represent safety, income, and price appreciation potential when uncertainty and fear dominate financial markets.
Now we watch TLTs for a second close over the 50-DMA to confirm a phase change and as importantly,
Perhaps the new (again) place to park money.
On April 22nd, I wrote a Daily investment research update about the similarities between 2022 and 2025.
Long bonds bottomed long before the Fed actually cut rates.
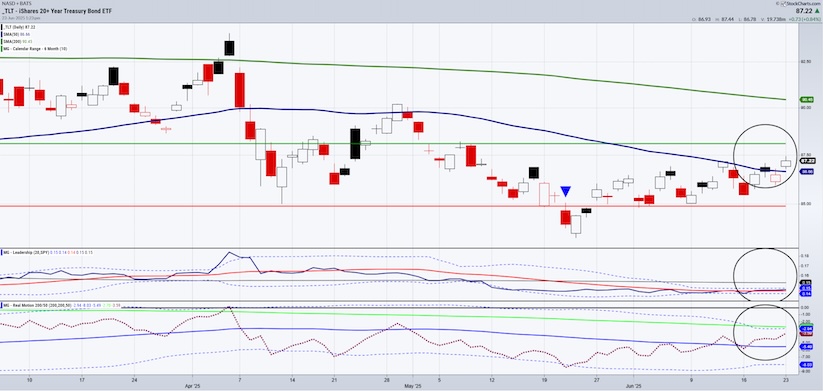
The circles show:
- The phase change with confirmation of another close above the 50-DMA needed.
- The leadership indicators showing that today for the first time since May, TLTs are outperforming SPY (risk off)
- Real Motion, now in a bullish divergence with momentum rising more than price, also must confirm.
The January 6-month calendar range high is around 88.08. We are watching for that to clear as well.
Twitter: @marketminute
The author may have a position in mentioned securities at the time of publication. Any opinions expressed herein are solely those of the author and do not represent the views or opinions of any other person or entity.


