Even before the Israeli/Iran crisis, crude oil was on our radar and in our portfolio over $62 a barrel.
Shale oil supply could be peaking. Rig counts were down for weeks.
As well, the US withdrew nearly 11 million barrels from the reserves.
Producers cannot afford to drill or refine with oil too cheap.
Now with the Middle East crisis, oil is trading over $74 a barrel. Any escalation will drive oil to $95-100.
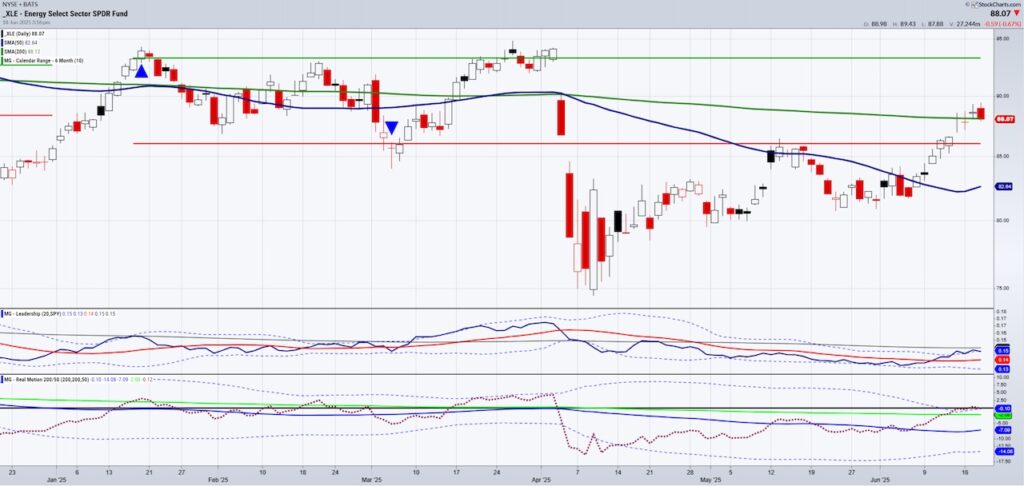
So it’s understandable why the Energy Sector ETF (NYSEARCA: XLE) has pressed higher.
The Implications
High seasonal demand for energy with a grid system already stressed.
AI/data centers are increasing and use/need a lot of energy.
Uranium is on the table, but it will be a while yet and as oil goes up, so do the costs of everything-mining, etc.
Natural Gas (most used energy source and cheapest) will rise as well-still under $4 but could get to $15-20).
The chart above is of the Energy Sector ETF (XLE).
XLE’s portfolio is heavily weighted towards large energy companies, with Exxon Mobil Corporation and Chevron Corporation making up a significant portion of its holdings.
During 2025, the price of XLE has been under pressure.
Now, XLE is clearing the 200-DMA. A move over $90 would clear all the price action since before the tariff crash in early April.
What about solar energy?
Solar plummeted due to the Senate’s version of the tax bill cutting renewable energy incentives. (BTW kept them for nuclear, hydropower and geothermal energy)
Does that matter?
Not really.
- Solar is needed along with wind to meet energy demands
- It has gotten alot cheaper, so tax incentives don’t matter as much.
- Oil and gas are getting costlier which leads to interest in solar and wind.
- By 2028 who knows what will be going on with energy demands.
I looked at a lot of charts for solar and wind.
This is by far the most interesting:

This is the Clean Energy ETF (NYSEARCA: PBW). It has a diversified sector exposure, with significant holdings in technology, industrials, consumer cyclical, basic materials, and utilities.
As of recent data, some of the top holdings include:
- Navitas Semiconductor Corp Class A (NVTS)
- Sunrun Inc (RUN)
- American Superconductor Corp (AMSC)
- EVgo Inc Class A (EVGO)
The chart shows higher prices possible. Momentum is clearly in bullish divergence.
In February 2021, the Clean Energy ETF (PBW) peaked at 138.60. I’d venture to say the fundamental backdrop is even more compelling than in 2021.
Twitter: @marketminute
The author may have a position in mentioned securities at the time of publication. Any opinions expressed herein are solely those of the author and do not represent the views or opinions of any other person or entity.


