Nearly every day that the financial markets are open, you can catch a series of interesting stock market charts on See It Market’s Twitter stream. Today we looked at a handful of stocks and market indicators.
Below you’ll see a short-term indicators for the S&P 500 ETF (NYSEARCA:SPY), investor sentiment and market breadth indicators, and stock charts for names like Starbucks (NASDAQ:SBUX), Boeing (NYSE:BA) and more.
Please share your ideas and any key charts you are watching with us. Just comment below or tweet us @seeitmarket.
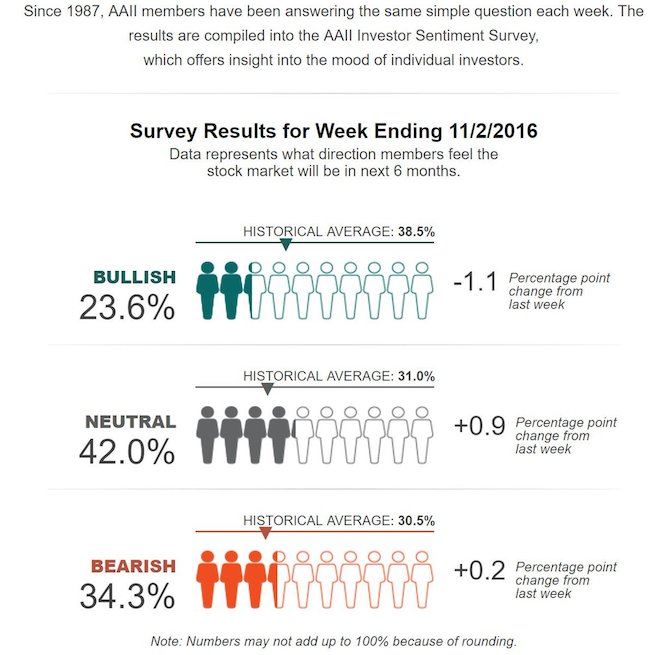
1). Investor Sentiment has been in gutter for a while now. Actually, sentiment has been less bullish than historical average for over a year now. Will this ultimately be a contrarian indicator?
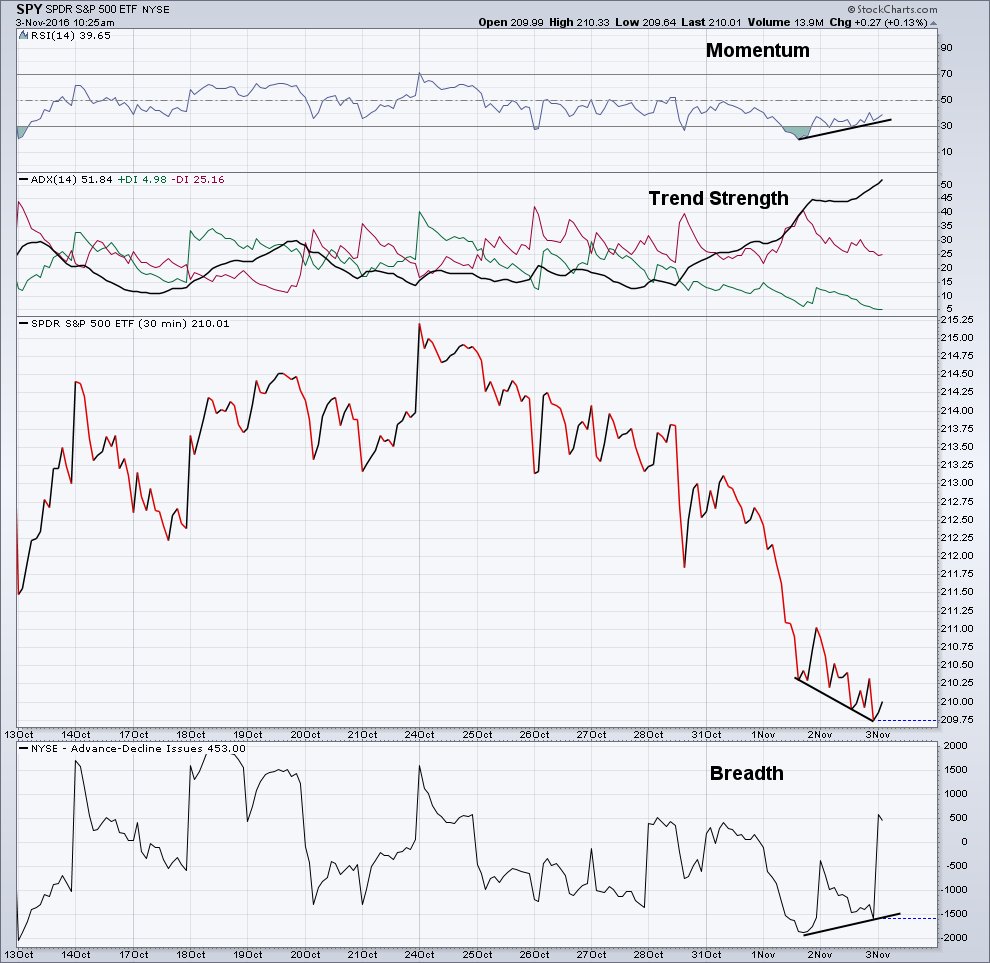
2). A bullish momentum divergence is forming on the S&P 500. This chart comes from @AndrewThrasher.
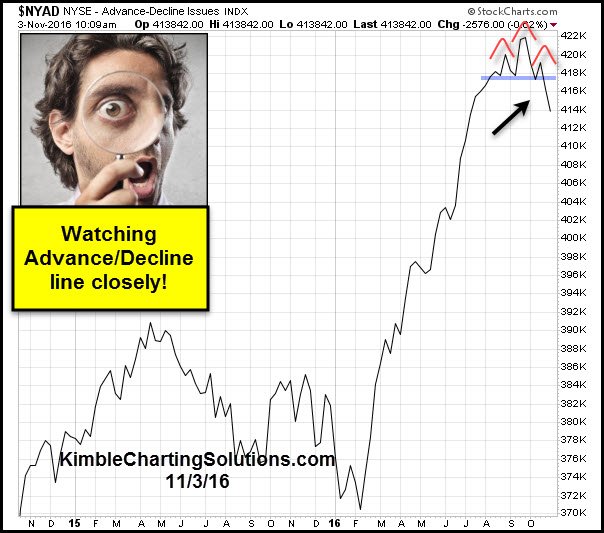
3). The NYSE Advance/Decline Line has formed a bearish chart pattern. Chart from @KimbleCharting.
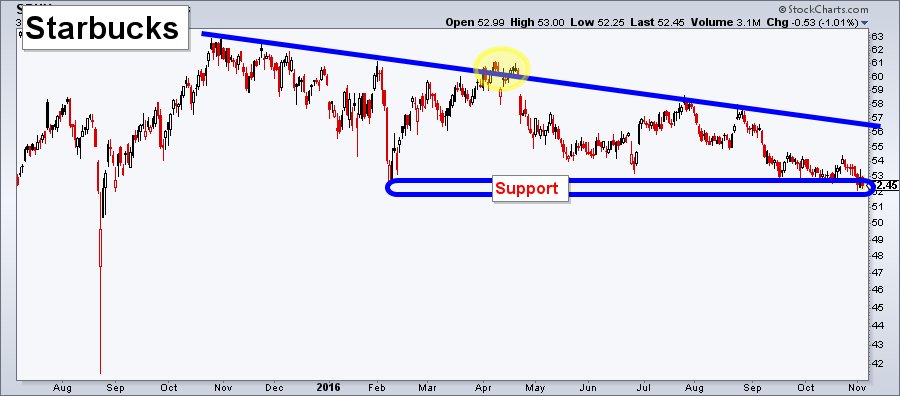
4). Starbucks stock is sitting on important price support into tonight’s earnings report.
continue on the next page…
: Creating Bullish Divergence?")


: Creating Bullish Divergence?")