Interesting Stock Market Themes
We have been of the view that the S&P 500 (NYSEARCA: SPY) is consolidating within the context of a secular uptrend and is likely to resolve to the upside, which remains the intermediate-term case.
However, in the near-term we have expressed caution due to weak stock market seasonality (especially in a mid-term election year). Now we are beginning to see signs of risk aversion in some of the key relationships which we track. Below are six to consider and follow.
You can gain more insights into our methodology and stock picking over at Chaikin Analytics.
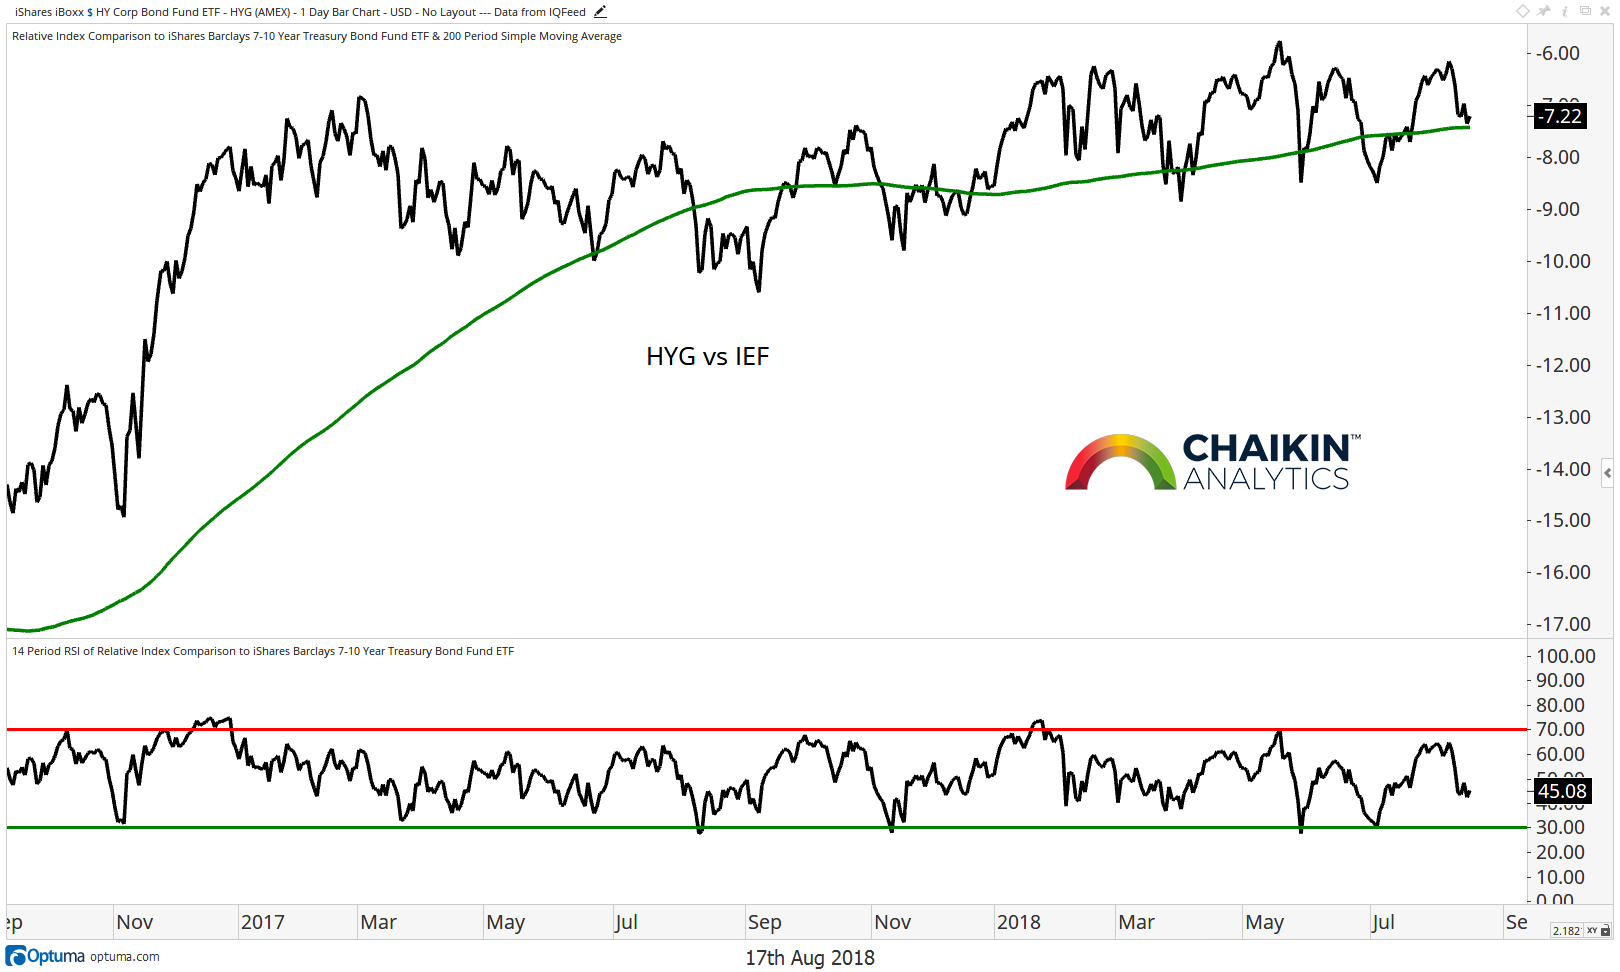
High Yield to Treasuries Ratio
The performance of high yield bonds relative to treasury bonds can be a barometer for risk appetite in the market. Here we have the ratio of high yield (NYSEARCA: HYG) to the 7-10 Year Treasury Bond (NYSEARCA: IEF). When this ratio is on the rise, it means that high yield is outperforming, and investors are showing a willingness to take on risk.
The ratio is moving down from the high end of the roughly 19 month range and testing support at the 200-day moving average. The RSI of the ratio has also turned lower after failing to become overbought. A move to new highs in conjunction with a breakout by the S&P 500 would be a bullish confirmation that the secular uptrend is resuming. However, a breakdown would be a warning for the bulls.
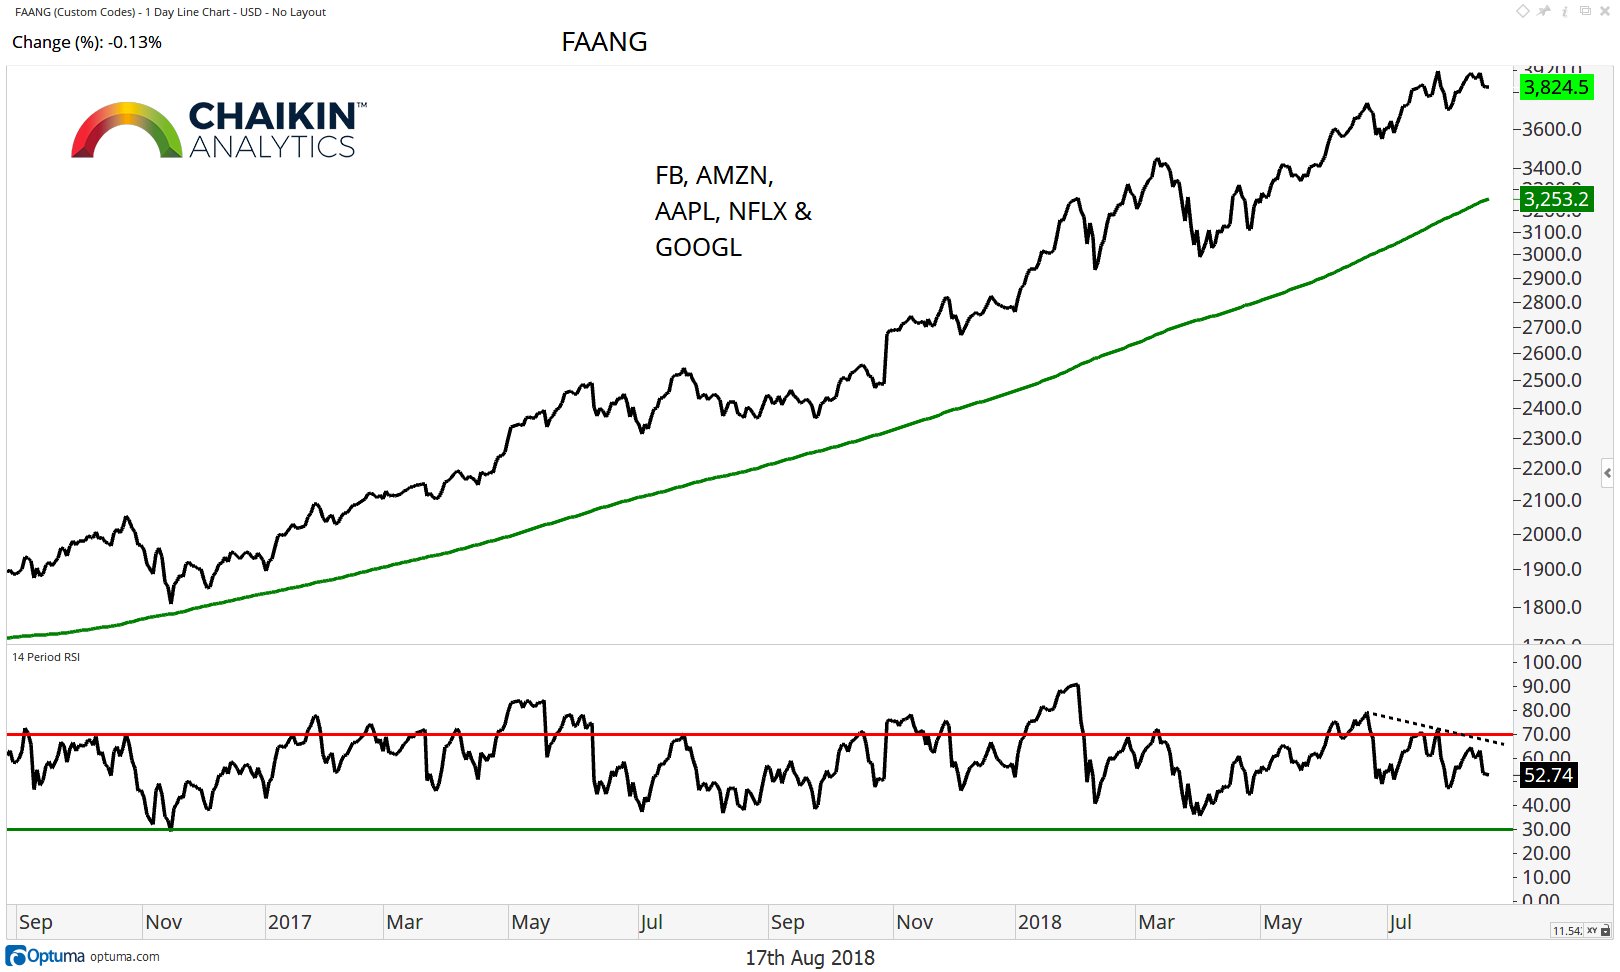
FAANG Stocks
The FAANG (Facebook, Amazon, Apple, Netflix & Google) stocks are the market generals and their performance is likely to have a big impact on the overall direction it takes. The group (based on a custom index which we built) is fading from resistance at the recent highs as FB and NFLX have, once again, come under pressure. AMZN and GOOGL are consolidating and AAPL has broken to new highs. Momentum remains in bullish ranges, based on the RSI, and has not become oversold since November 2016. One development we are watching is the series of lower highs in the RSI indicator which have not confirmed the price highs.
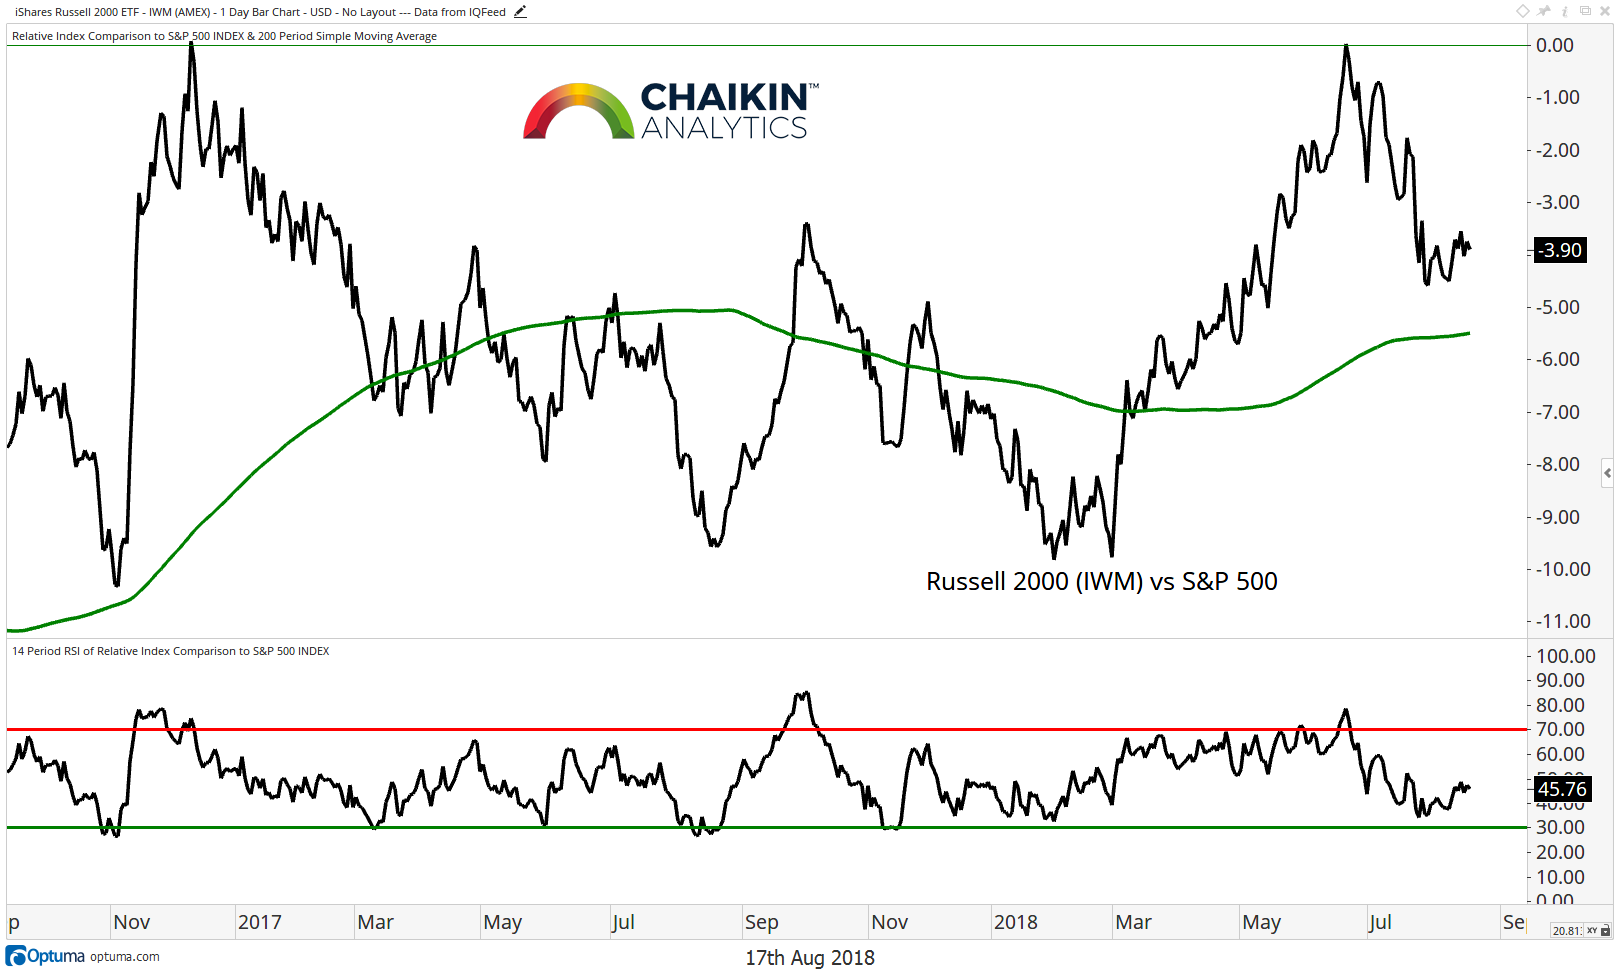
Small Cap’s Relative Performance
This is a theme we focus on because it highlights market breadth as well as risk appetite. If the small caps are outperforming, that is a bullish indicator for the market because small stocks are viewed as more risky than large and it shows broader participation at the stock level. Here is the Russell 2000 ETF (NYSEARCA: IWM) relative to the S&P 500 and we can see that the small caps are trying to form a base above the 200-day moving average. The RSI did not register an oversold reading during the recent pull back.
We are closely watching the dollar, as continued strength in the currency could lead to small caps beginning to outperform again. A resumption of the uptrend which began in February should have bullish implications for the market.
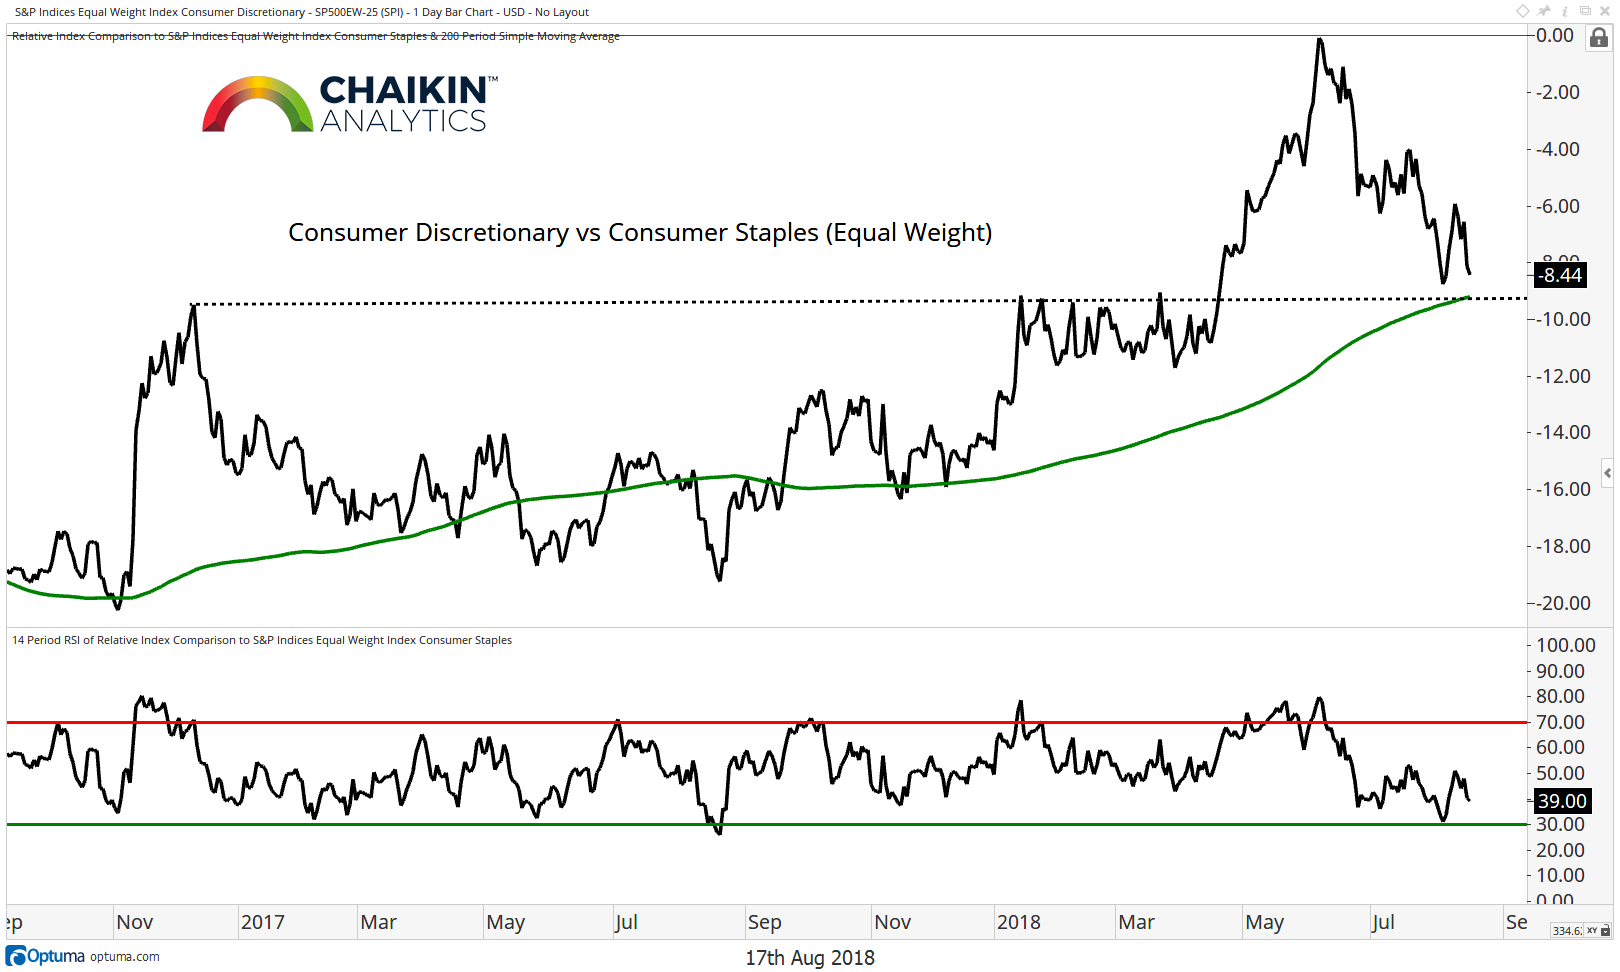
The Consumer Discretionary to Consumer Staples Ratio (Equal Weight)
The ratio of Consumer Discretionary stocks to Consumer Staples stocks is, again, testing support at the key breakout level (dashed line) just above the rising 200-day moving average. The RSI has not been able to register an oversold reading during the pullback but is having trouble moving back to bullish ranges. The benefit of the doubt remains with Discretionary for now, but a break of support would have negative implications for the ratio.
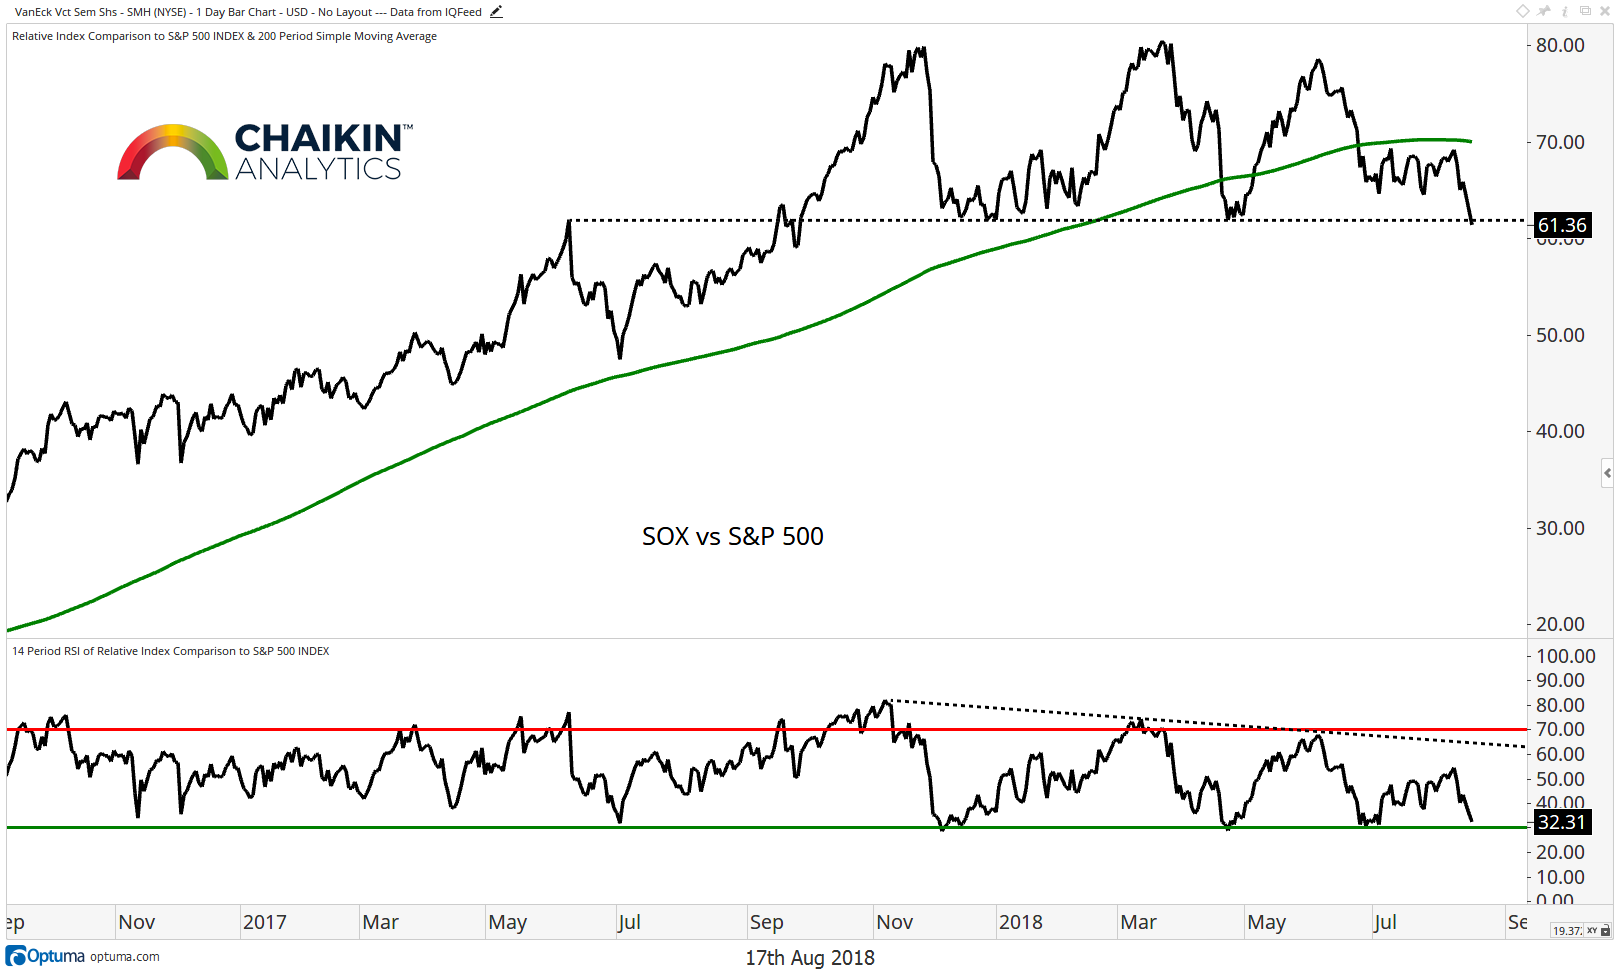
Semiconductors Relative to the S&P 500
Semiconductors are on the verge of breaking support relative to the S&P 500 (and the news from NVDA and AMAT last night will not help). The ratio also remains below the 200-day moving average. The RSI has marked a series of lower highs and failed to become overbought during the latest move higher. A break of support would be concerning to us and further deterioration could be a negative for the market.
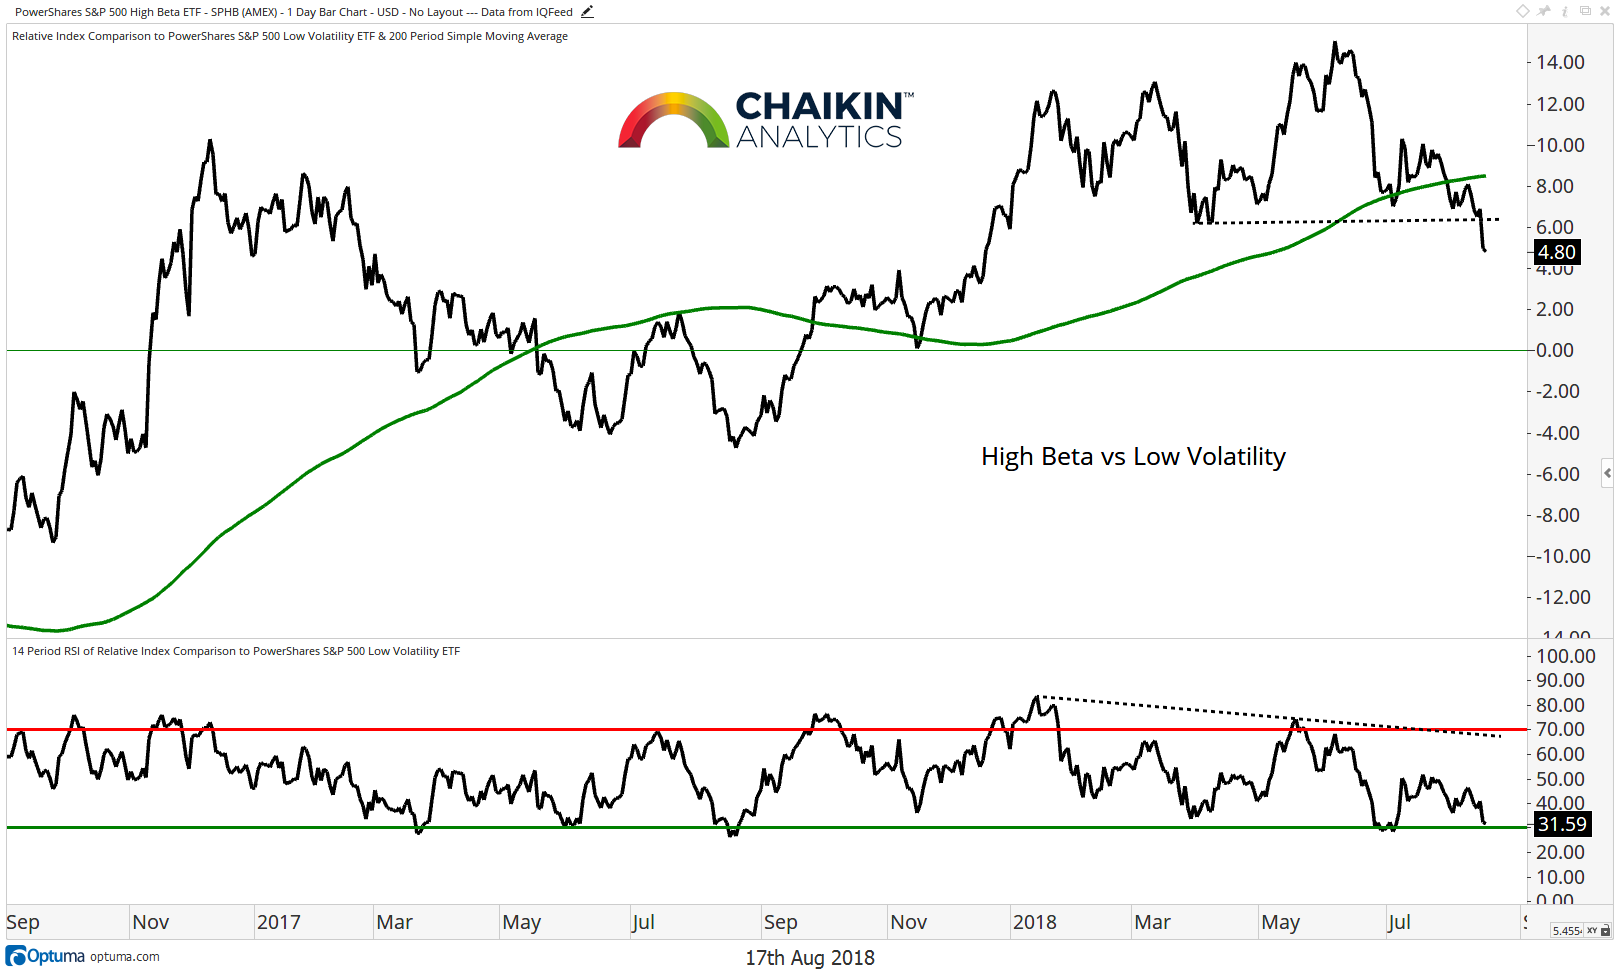
High Beta Relative to Low Volatility
Another way to measure the risk appetite of investors is to look at the performance of the PowerShares S&P 500 High Beta ETF (SPHB) relative to the PowerShares S&P 500 Low Volatility ETF (SPLV). We can see that the ratio has broken support and the rising 200-day moving average following a negative divergence between price and momentum. The RSI has moved to bearish ranges and was able to reach an oversold condition in July. This breakdown concerns us from a risk perspective.
Take-Away: The key relationships which we track are beginning to concern us in the near-term as many remain in a consolidation and are not moving to new highs. The potential breakdown in the semiconductors is our biggest worry as that ratio has a high, positive, correlation to the direction of the market. Additionally, the shift to low volatility from high beta is a sign that investors may be getting risk averse.
Twitter: @DanRusso_CMT
Author may have a position in mentioned securities at the time of publication. Any opinions expressed herein are solely those of the author, and do not in any way represent the views or opinions of any other person or entity.


