With the S&P 500 (NYSEARCA: SPY) trading toward the all-time highs from January, it’s important to look at some of the key stock market relationships beyond the high level indexes.
These relationships can help us to identify if the secular uptrend is likely to resume.
Here are 6 themes that traders should tune into:
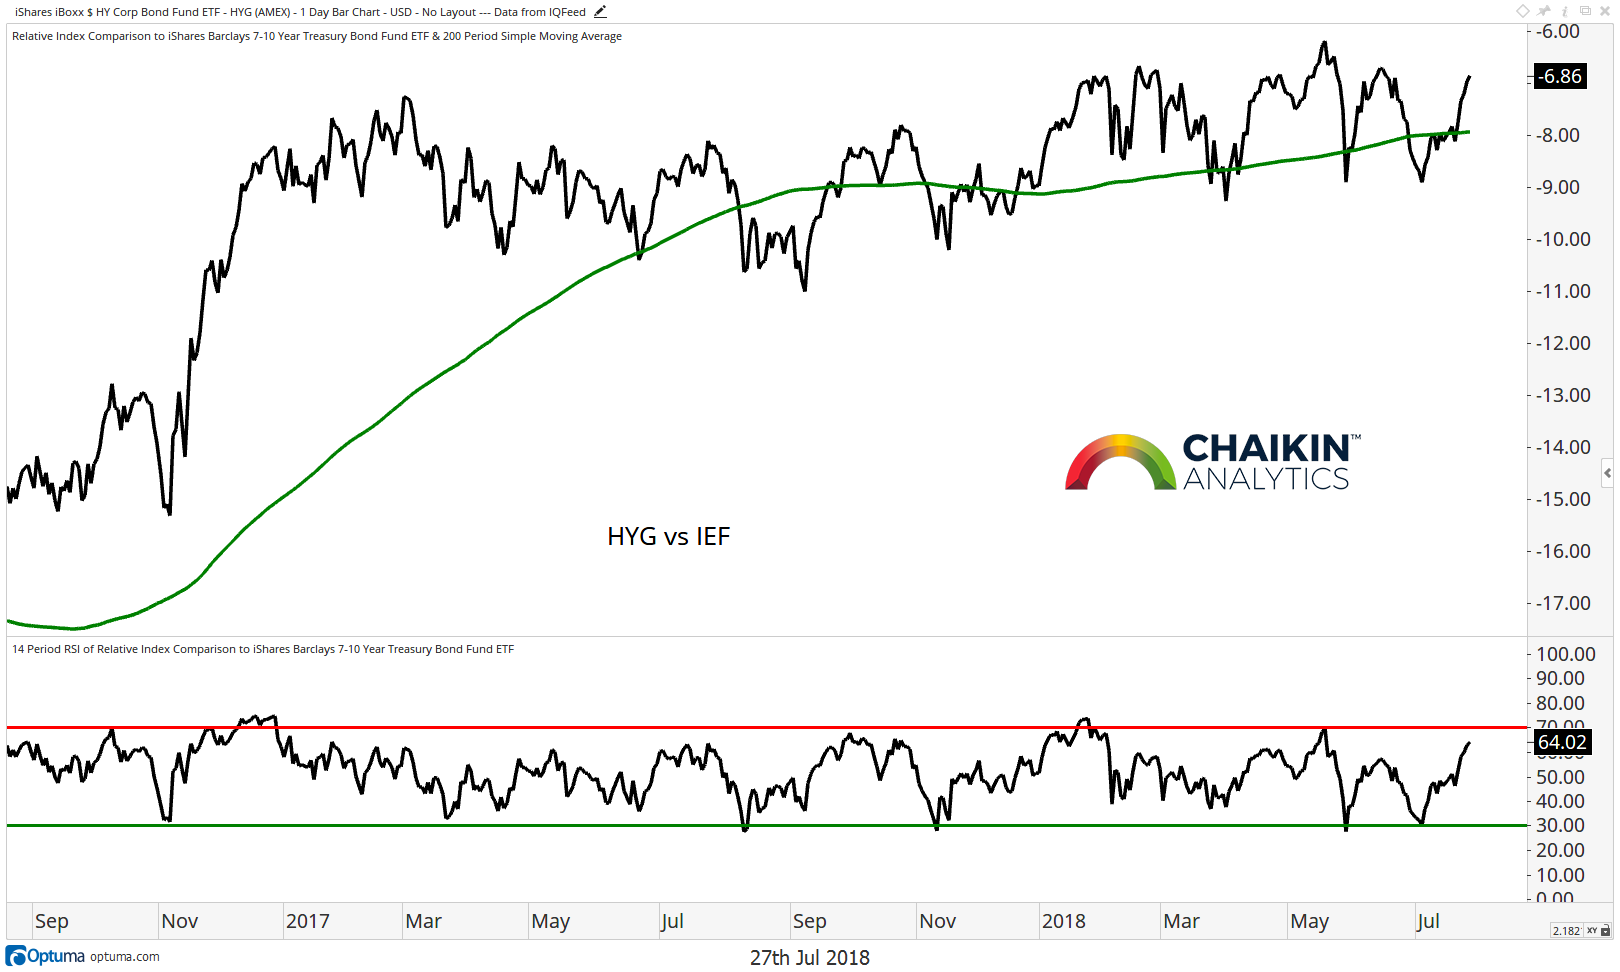
High Yield to Treasuries Ratio
The performance of high yield bonds relative to treasury bonds can be a barometer for risk appetite in the market. Here we have the ratio of high yield bonds (NYSEARCA: HYG) to Intermediate-Term Treasuries (NYSEARCA: IEF).
When this ratio is on the rise, it means that high yield is outperforming, and investors are showing a willingness to take on risk. The ratio is once again testing the high end of the roughly 19 month range. The RSI of the ratio is moving toward overbought conditions. A move to new highs would increase the odds that the S&P 500 is going to resume its secular uptrend. However, a breakdown would be a warning for the bulls.
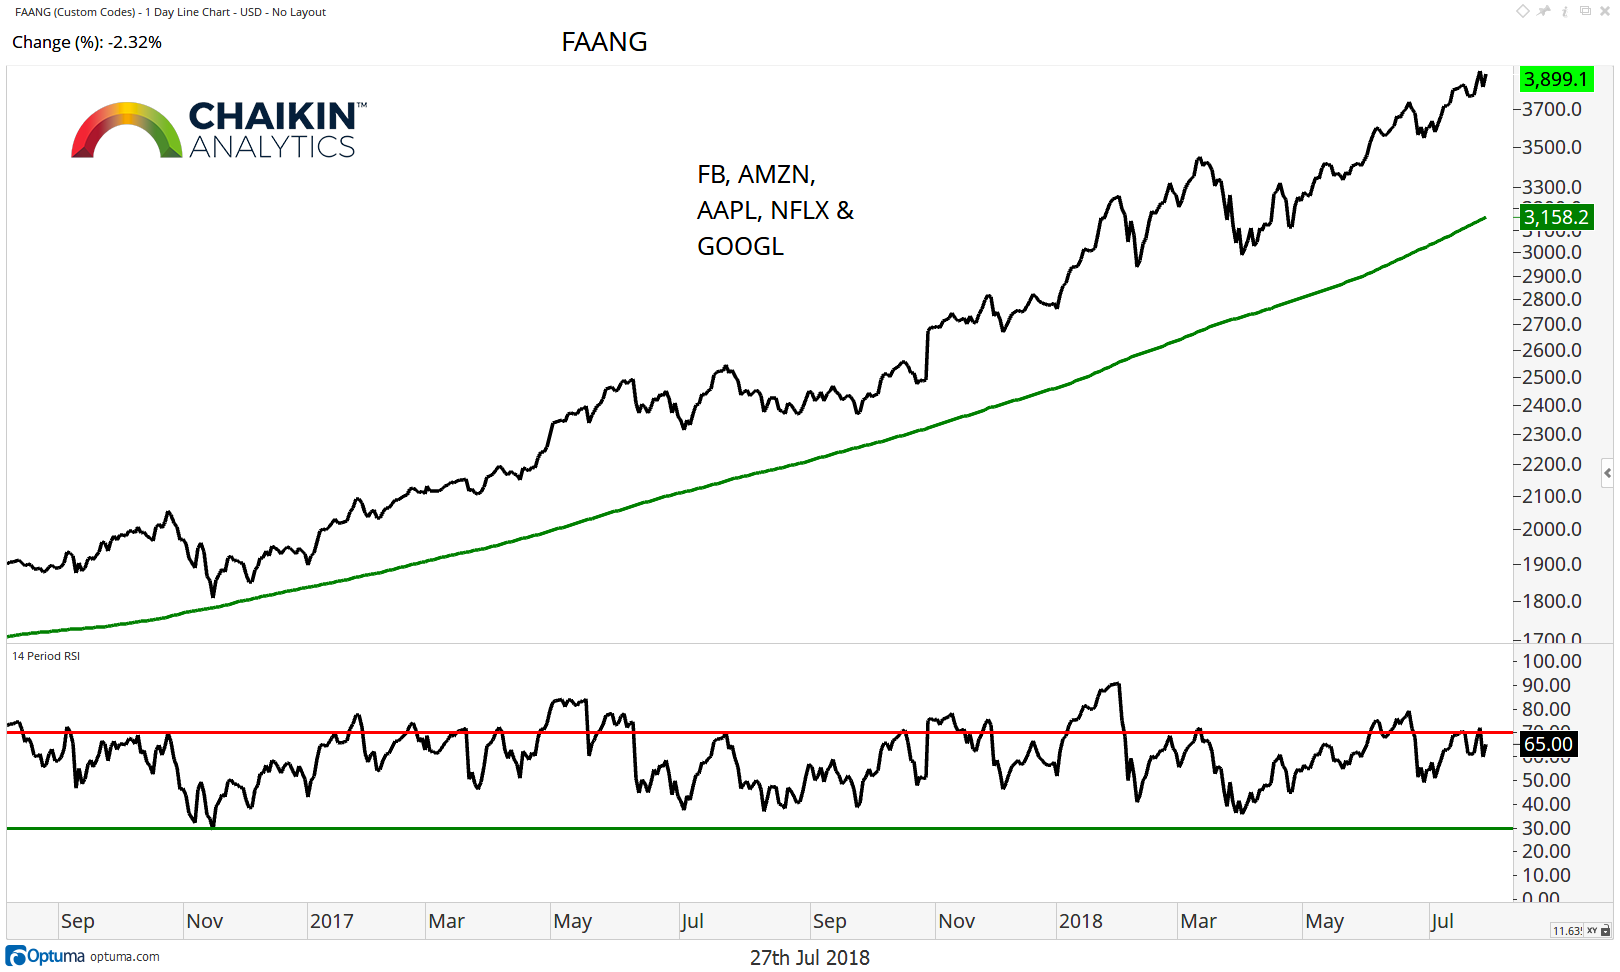
FAANG Stocks
The FAANG stocks (FB, AMZN, AAPL NFLX & GOOGL) are the market generals and their performance is likely to have a big impact on the overall direction it takes. The group (based on a custom index which we built) has broken to new highs which should have bullish implications for the market overall. Momentum remains in bullish ranges, based on the RSI, and has not become oversold since November 2016. Interestingly, the large decline in FB yesterday did not do any technical damage to this trend.
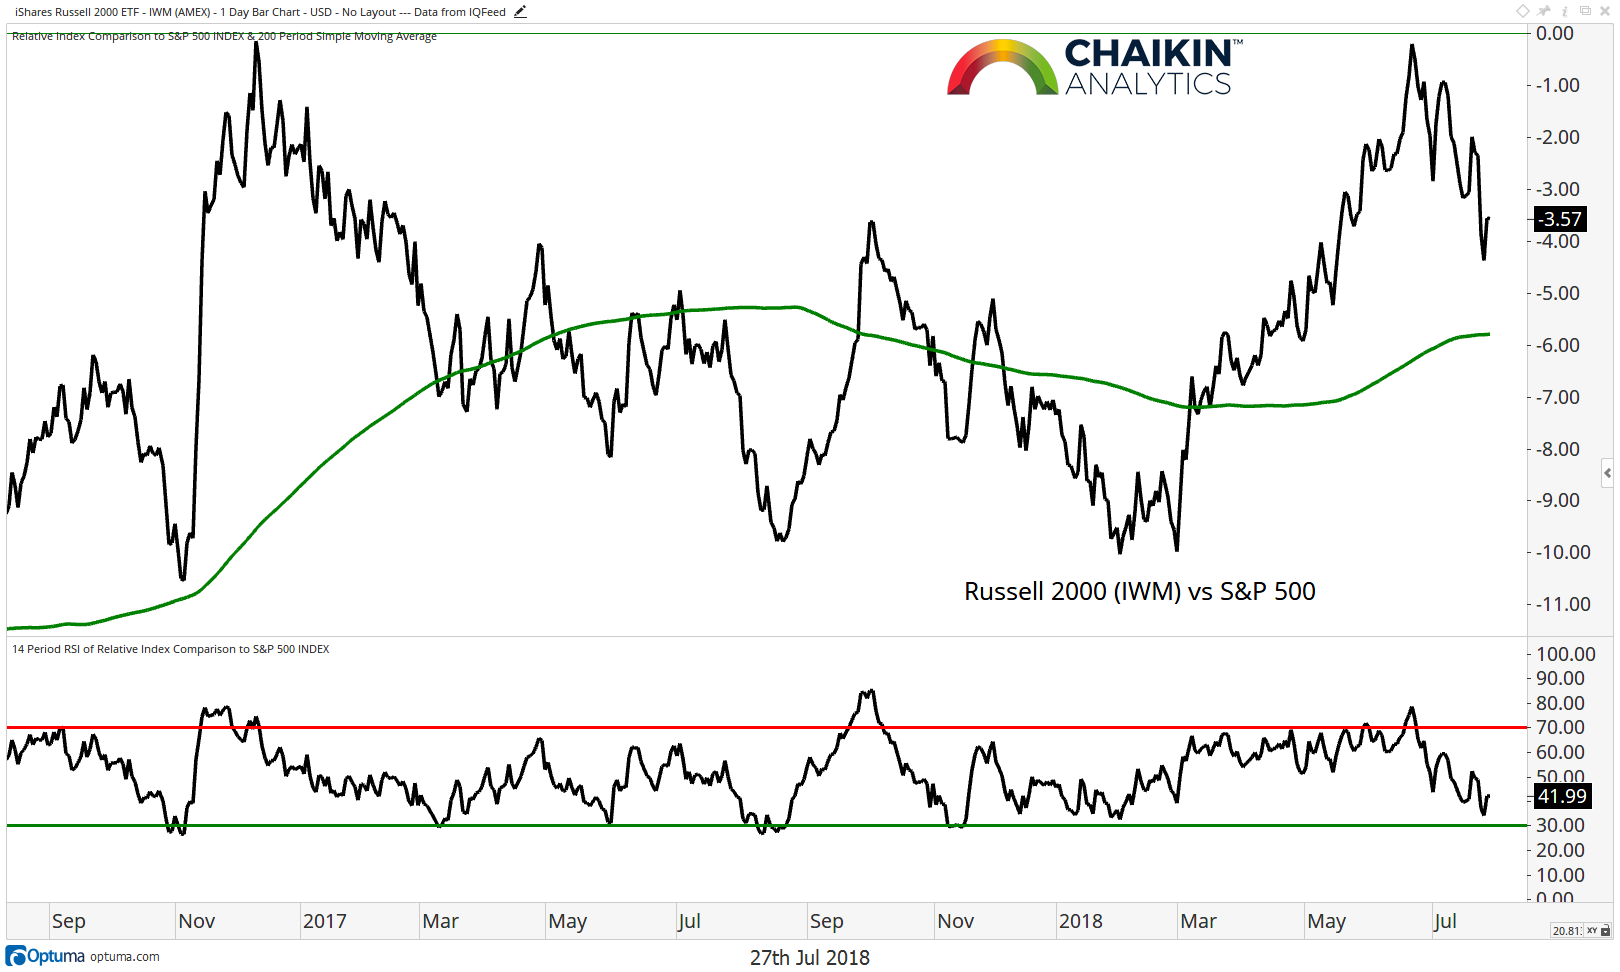
Small Cap’s Relative Performance
This is a theme we focus on because it highlights market breadth as well as risk appetite. If the small caps are outperforming, that is a bullish indicator for the market because small stocks are viewed as more risky than large and it shows broader participation at the stock level. Here is the Russell 2000 ETF (NYSEARCA: IWM) relative to the S&P 500 and we can see that the small caps are continuing to consolidate at the 2016 highs. The RSI has move toward oversold conditions but did not register an oversold readings. On Monday we wrote that we are not chasing small caps and we continue to wait for this ratio to stabilize before changing that view.
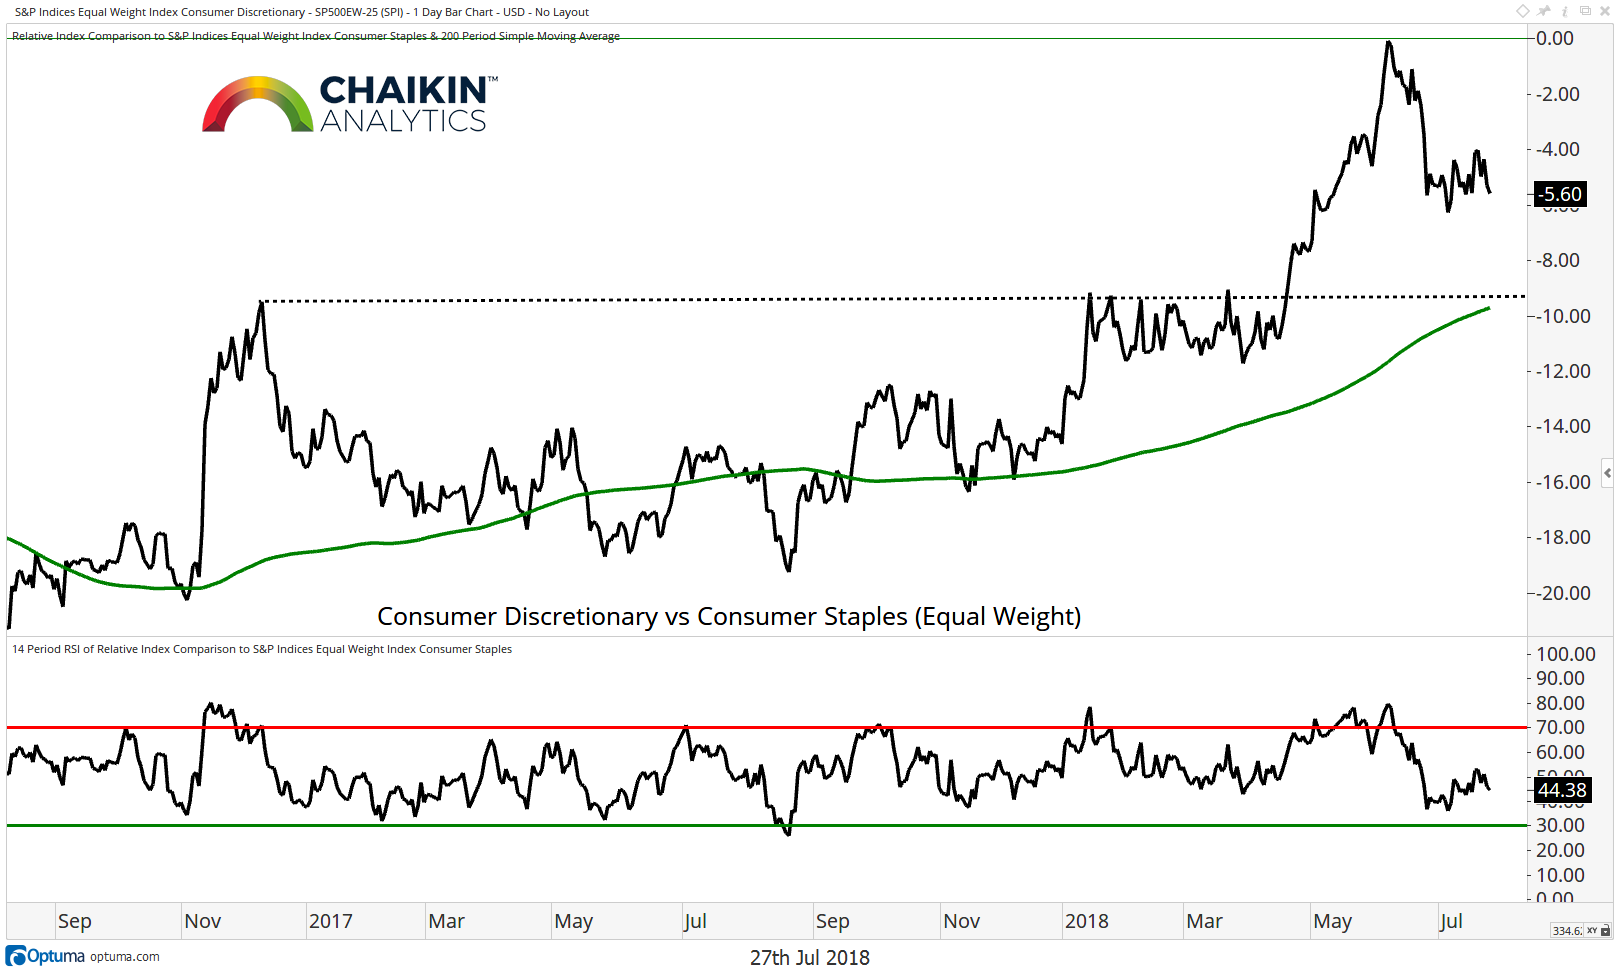
The Consumer Discretionary to Consumer Staples Ratio (Equal Weight)
The ratio of Consumer Discretionary stocks to Consumer Staples stocks continues to consolidate after registering strong overbought readings. For now, this seems like a healthy pause after a strong move higher. The RSI has not been able to register an oversold reading during the pullback, and is now moving higher, which speaks to the strength of the bullish trend. Odds favor a continuation of the uptrend.
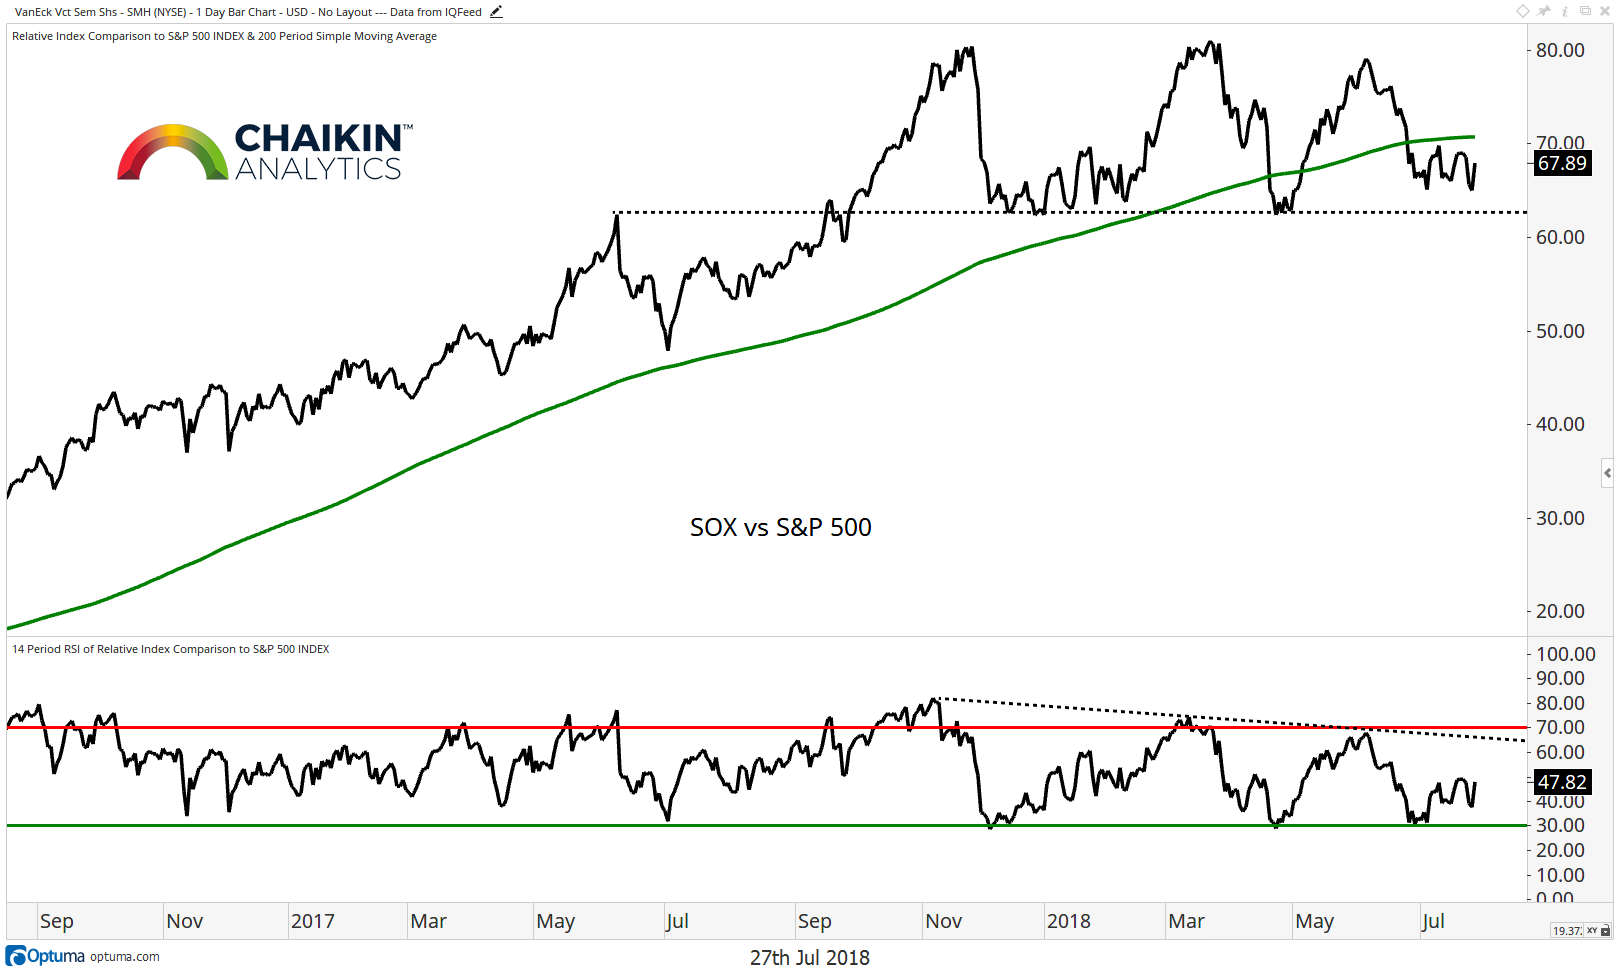
Semiconductors Relative to the S&P 500
Semiconductors continue to consolidate relative to the S&P 500. The ratio has moved below the 200-day moving average but remains above support. The RSI has marked a series of lower highs and failed to become overbought during the latest move higher. A break to new highs would have bullish implications for the broader stock market but more time is needed before that takes place. This relationship has a very high correlation to the overall stock market; we are watching the support level closely.
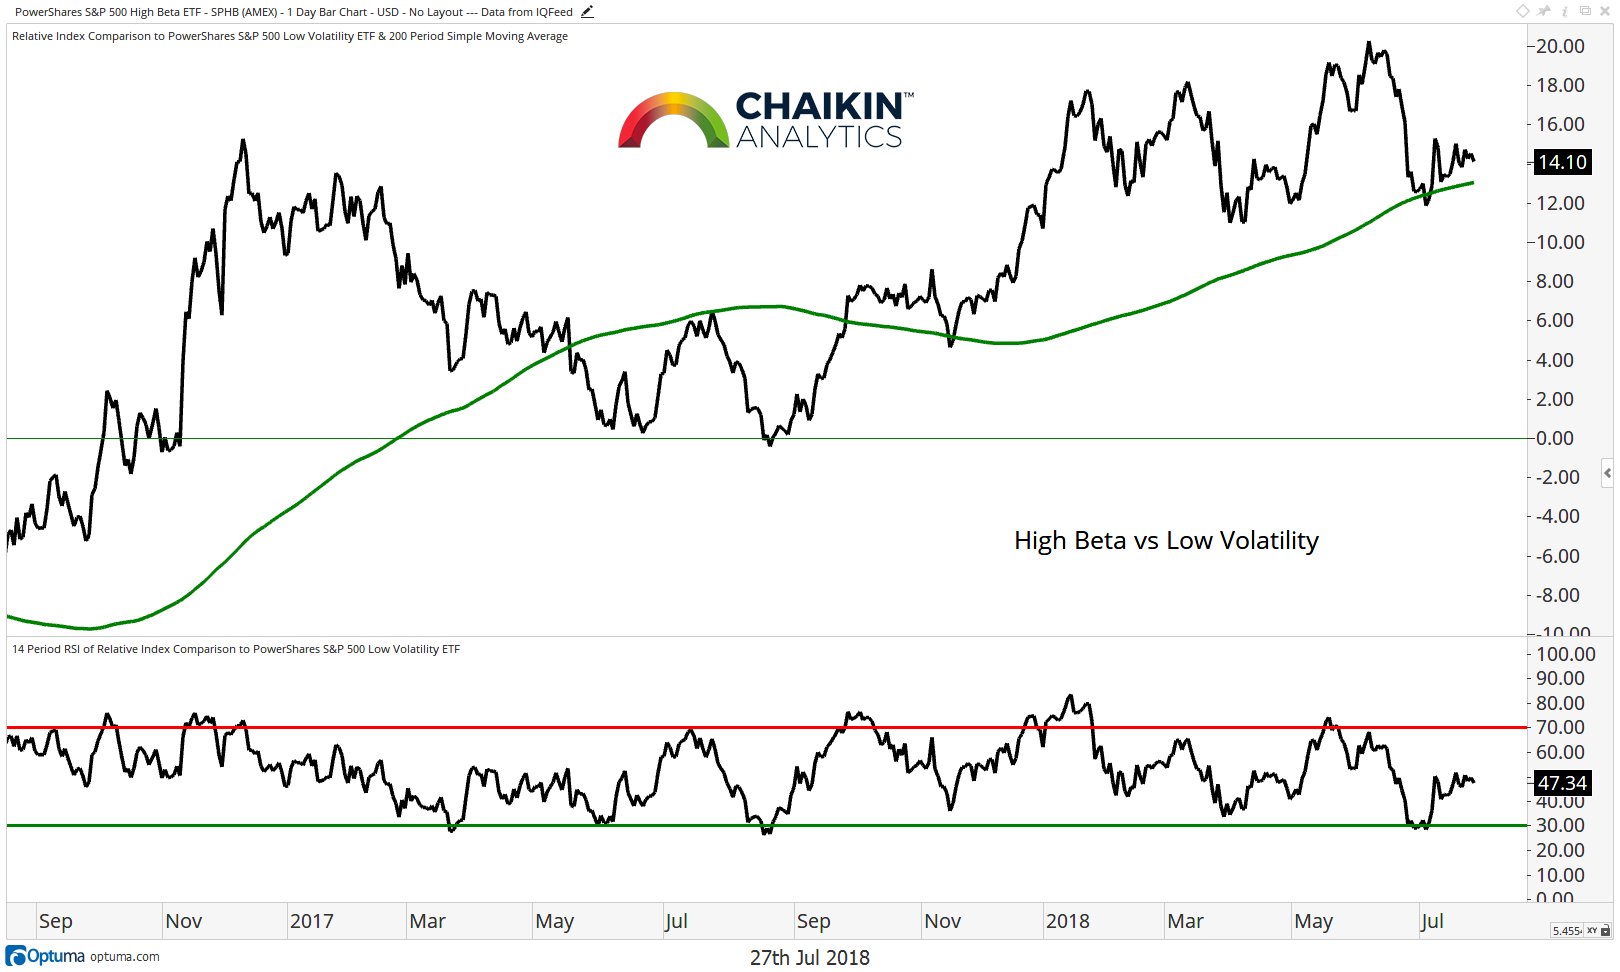
High Beta Relative to Low Volatility
Another way to measure the risk appetite of investors is to look at the performance of the PowerShares S&P 500 High Beta ETF (SPHB) relative to the PowerShares S&P 500 Low Volatility ETF (SPLV). We can see that the ratio is finding support at the rising 200-day moving average following a negative divergence between price and momentum. The RSI is back to the middle of the range. Odds favor a resumption of the uptrend
Take-Away:The key relationships which we track continue to confirm the trading which we see in the S&P 500. Most are consolidating (other than FAANG) within uptrends. Breaks to new highs will have bullish implications for the market.
You can gain more insights into our methodology and stock picking over at Chaikin Analytics. Thanks for reading.
Twitter: @DanRusso_CMT
Author may have a position in mentioned securities at the time of publication. Any opinions expressed herein are solely those of the author, and do not in any way represent the views or opinions of any other person or entity.


