Reality Check
Wall Street bank analysts have a conflict of interests when it comes to rating other banks and bank stocks, they just do. But, this is how the best of the best would do it, if their hands and jobs weren’t tied in knots.
How to measure a bank
There are six critical measures to examine. For purposes of this analysis, we are looking at the North American banks over $4 billion in market cap.
1. Operating Revenues/Operating Expense (TTM)
Simply stated, this measures much revenue is generated per $1 of operating expense. Below we plot the entire population and equal space them (rank them) on the x-axis, while measuring operating margin on the y-axis.
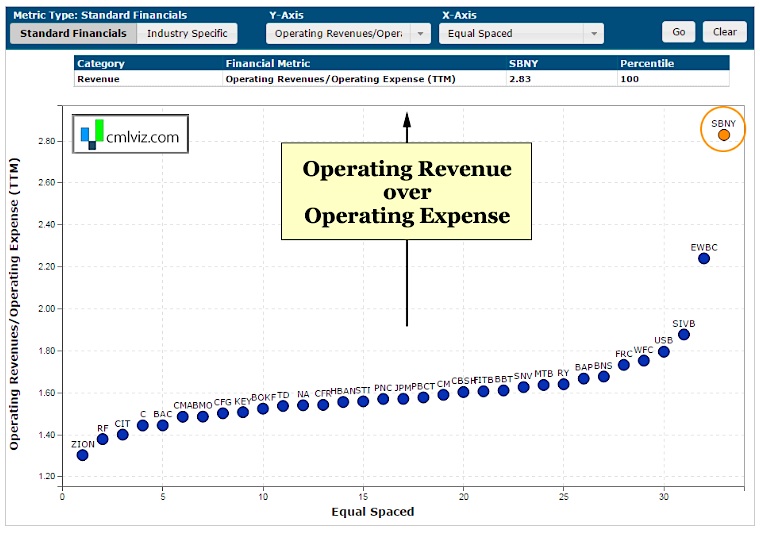
We’re going to notice a trend here. Signature Bank (SBNY) has the highest operating margin by a large amount, earning nearly $2.85 in revenue for every $1 in expense.
The following video is a great reference and shows you how we pulled this data on CMLviz.
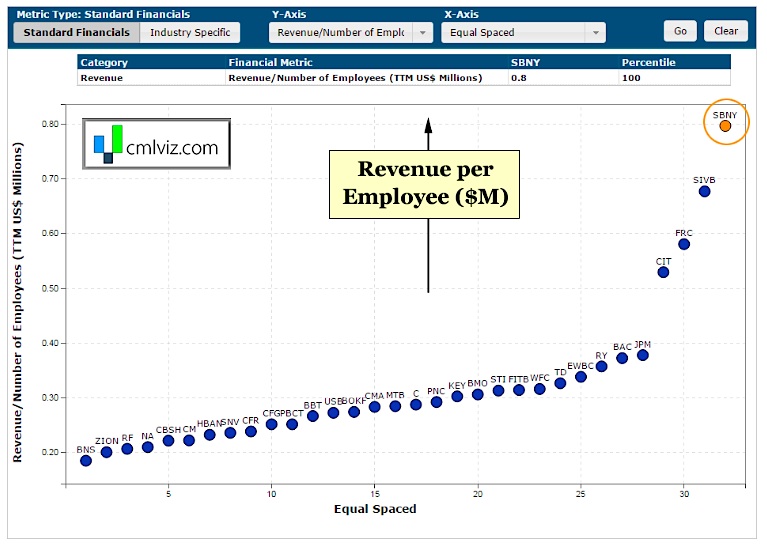
2. Revenue/Number of Employees (TTM US$ Millions)
Banks have a tendency to get bloated with employees and this is my favorite measure of the “anti-bloat.” we will look at revenue per employee in $million on the y-axis, and again, we will rank the companies on the x-axis.
Signature Bank (SBNY) generates $800,000 per employee. Incredibly, no other bank even generates more than $675,000.
CMLViz writes one story a day to uncover new opportunities and break news: Get (Free) News Alerts Once a Day.
3. Efficiency Ratio
This is similar to the first metric just upside down, but it excludes interest expense. A bank stock’s efficiency ratio is a measure of a bank’s overhead as a percentage of its revenue. On the y-axis, we now measure the bank population’s efficiency ratio. The lower this number is, the better.
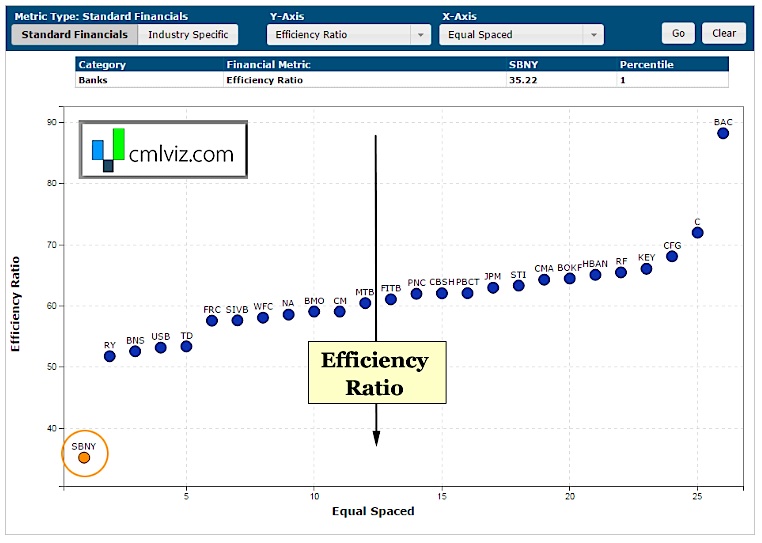
Of all the metrics we will look at this, this one is perhaps the most breathtaking. SBNY has incredibly good efficiency, showing by far the lowest overhead costs of all of its peers.
4. Level 3 Liabilities (Unobservable Prices)/Liabilities
Level 3 assets and liabilities are those that sit on the balance sheet with a value that is created by a financial model. Level 3 assets and liabilities have not traded in so long, that their market prices are considered “unobservable.” If a bank has large amounts of level 3 liabilities (or assets), there could be some gamesmanship to understate how bad the situation really is. I prefer zero or next to zero level 3 liabilities when look fro bank stocks.
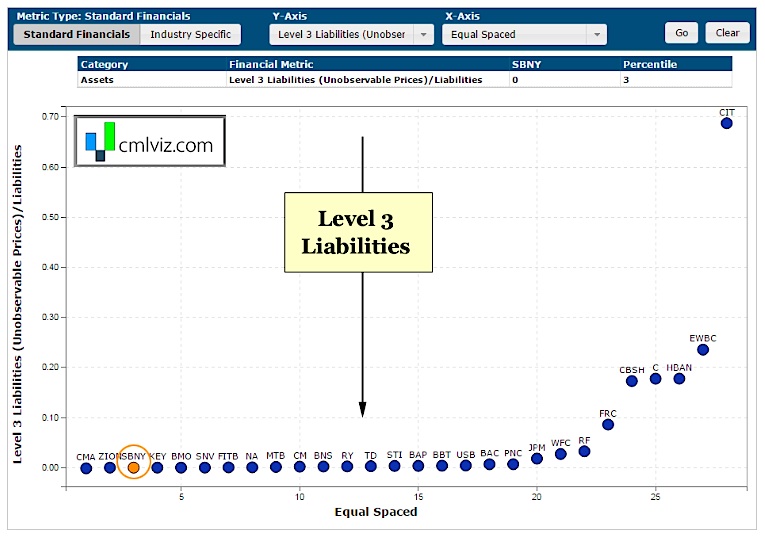
Signature Bank, SBNY, is in a tie with a few banks. The level we are looking at is zero. Perfect. There are no liabilities on the balance sheet that have a valuation that is created out of a model.
5. Net Income Margin %
Simply stated, this is after tax income / revenue. The higher, the better.
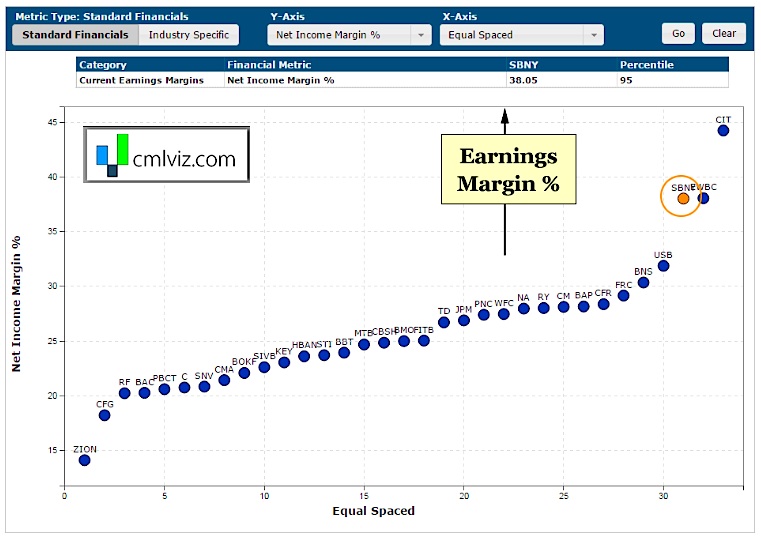
Signature Bank shows the the second highest net income margin, at a whopping 38%. That 38% is nearly 50% higher than the median value. Of course, this all makes sense given what we have seen above.
6. Non-Performing Loans/Loans
A non-performing loan is one that is in default or close to being in default. It usually hits the books as “non-performing” after 90-days, although that can vary. I want to see this metric low, but not zero. If a bank has zero non-performing loans, it isn’t taking on enough risk. On the other hand, if it has large non-performing loans, it has poor risk management and may face a massive write-down.
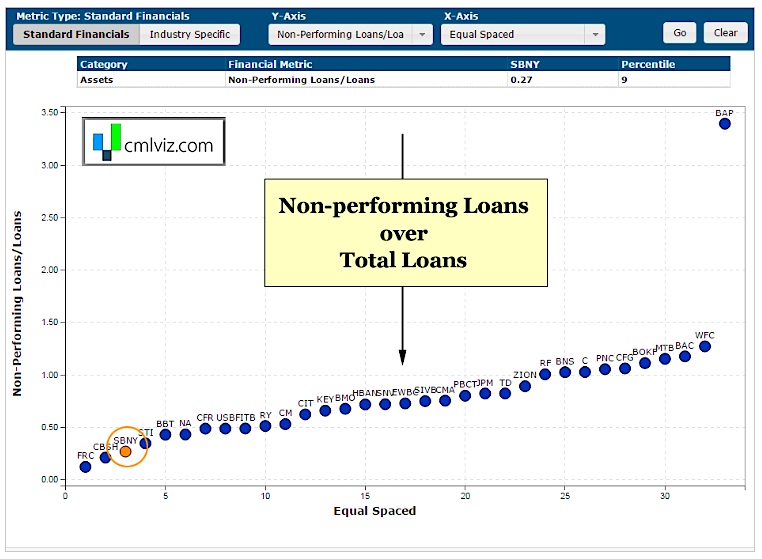
SBNY sits perfectly in the low range, but taking on enough risk that it has incurred some bad loans. In total, the bad loans for Signature Bank represent just 0.27% of total loans. Nice, neat, small, and not zero.
CONCLUSION
Signature Bank generates more revenue per operating expense than every bank, more revenue per employee than every bank, has lower overhead costs than every bank and has zero level 3 liabilities. Further, SBNY has an extremely high earnings margin and has managed risk perfectly with respect to its loan mix.
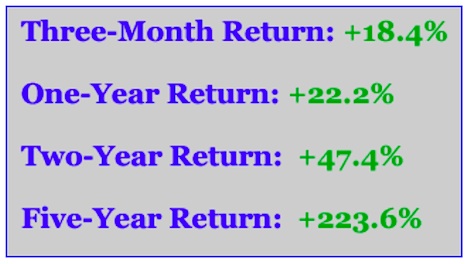
And the Result?
Here are Signature Bank’s stock returns over the last 3-months, 1-year, 2-years and 5-years.
This is how you beat Wall Street. This is how you win. At Capital Market Laboratories we discover the undiscovered.
Thanks for reading.
Read more from Ophir on CMLviz.com.
Twitter: @OphirGottlieb
Any opinions expressed herein are solely those of the author, and do not in any way represent the views or opinions of any other person or entity.


