The following research was contributed to by Christine Short, VP of Research at Wall Street Horizon.
Third quarter earnings season begins later this week, so in preparation for a slew of new reports we take a look at recent findings from RavenPack that continue to highlight the important information that can be culled from the timing of earnings dates.
Anyone familiar with the Wall Street Horizon DateBreaks Factor or Late Earnings Report Index (LERI) knows that academic research supports the idea that companies that advance their earnings date tend to share good news on their earnings calls, while those that delay tend to share bad news. Stock prices then follow directionally.
In their latest whitepaper, “Trading the Earnings Calendar,” RavenPack provides further research on this topic using Wall Street Horizon data, with five major findings that you should consider ahead of earnings season.
Finding 1: Changes in earnings announcement dates can be predictive of quarterly results
Just as other studies on earnings dates have concluded, RavenPack also finds that when a company moves their quarterly earnings date earlier than they have historically reported, it tends to correlate positively with good news on report day, while delaying an earnings report is predictive of bad news.
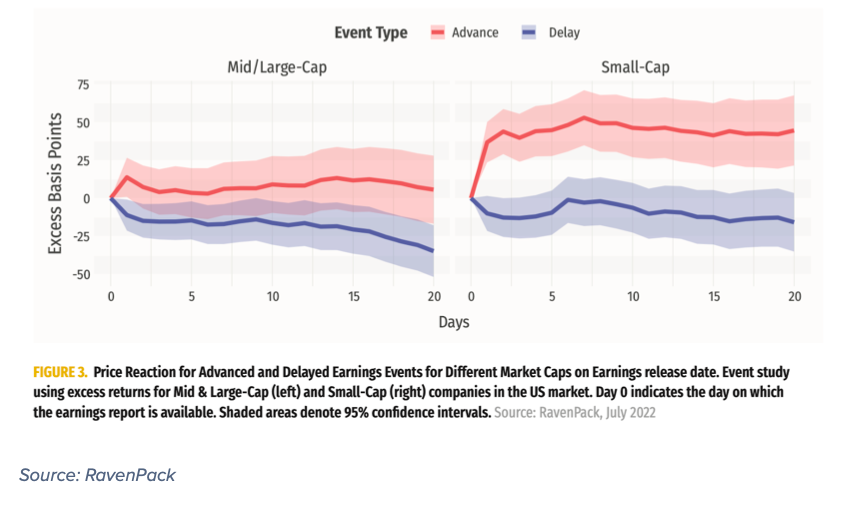
The first RavenPack strategy begins with an observation of the differences in post-earnings price reactions between advance (an earnings date is earlier than it has been historically) and delay (an earnings date is later than it has been historically) events within US Mid/Large- and Small-Cap universes. When looking at price reaction in the 20-day post-earnings period, mean excess returns are positive for advancers and negative for delayers across all market caps.
Figure 3 below shows how Mid/Large-Cap companies have a greater reaction to delayed dates and experience more momentum on the negative leg, while the Small-Caps react more to advanced dates resulting in greater momentum on the positive leg. The signal, although strong, decays relatively quickly, with the difference between the average advance and delay reactions reaching a peak in just a few days.
As a result of the observable differences in how advance and delay events affect stock performance, the first strategy pursued by RavenPack trades stocks just ahead of the confirmed earnings announcement date, going long on stocks that advance their earnings date and shorting those that delay.
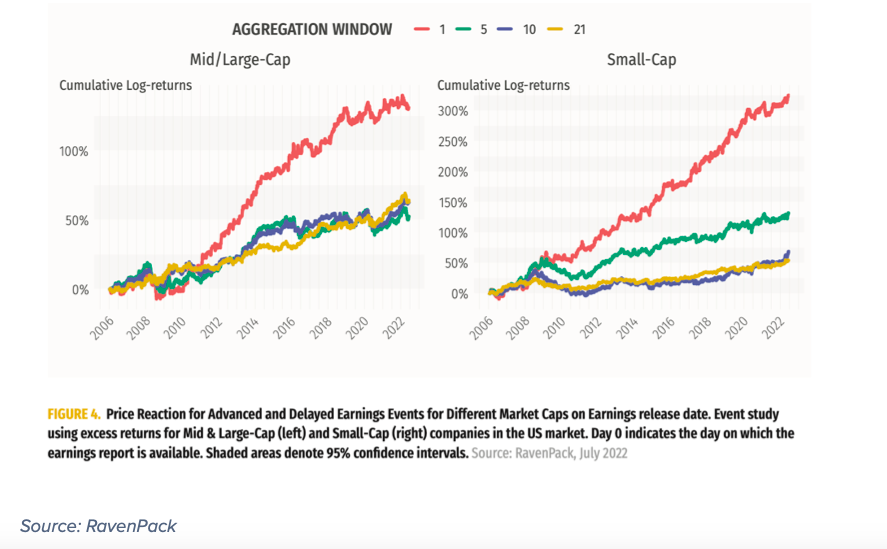
When using this long-short strategy across different aggregation windows and market caps (Figure 4), the 1-day aggregation window achieves the best results. At the 1-day mark, Annualized Returns reach 8.0% for the Mid/Large- Caps and 19.7% for Small-Caps, with Information Ratios of 0.8 and 1.2, respectively.
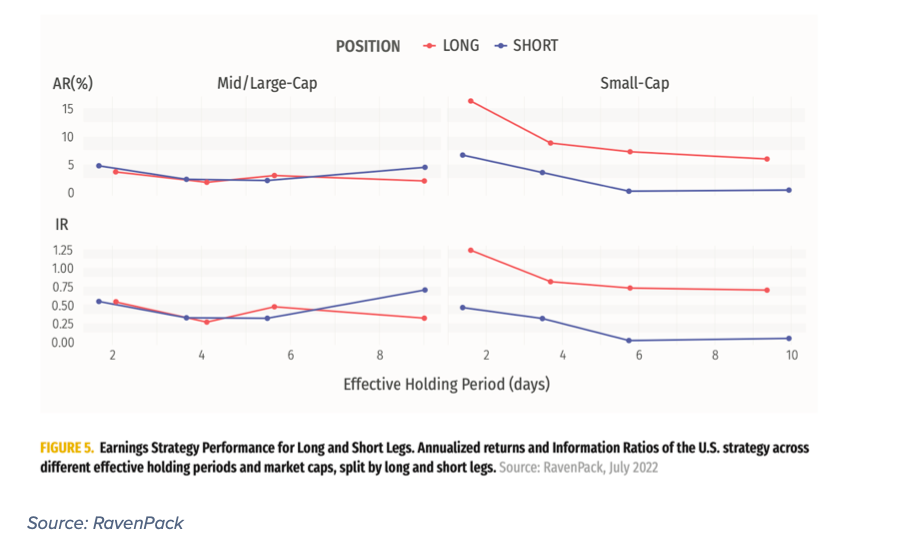
o take a deeper dive into these long and short legs, RavenPack constructed long-only and short-only strategies across different market caps and holding periods. As illustrated in Figure 5, they found that the short positions for Mid/Large-Cap names performed consistently across different aggregation windows, while long positions decayed over longer holding periods.
The opposite proved to be true of the Small-Cap universe. A stronger contribution came from long positions while the signals from short positions decayed more quickly.
Finding 2: Changes in earnings announcement dates are followed by outsized price reactions
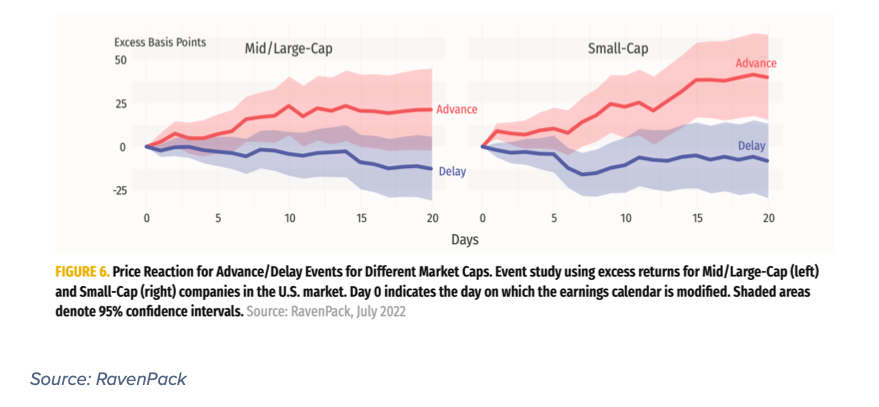
RavenPack also found that stocks not only reacted to what was being shared in quarterly earnings reports as predicted by the confirmed earnings date, but that stocks also reacted to the earnings date changes themselves (prior to the actual report being released). The second strategy focused on the price reactions around these sequential changes in earnings announcement dates.
As Figure 6 shows, companies that advanced an earnings date outperformed those that delayed, after the change was made. These events had stronger momentum than earnings events showcased in Figure 3. Again, Small-Cap companies were more sensitive to the changes and therefore exhibited greater price reactions between advance and delay events than the Mid/Large-Cap companies.
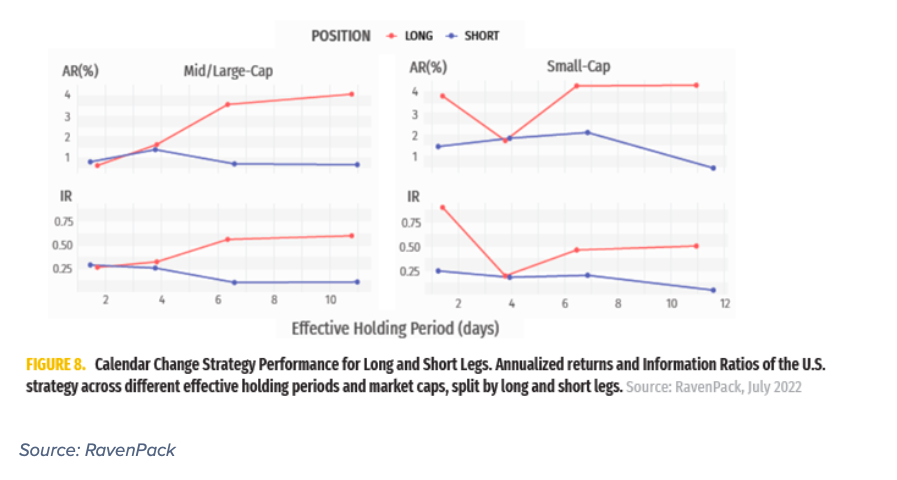
Once again, long and short legs were separated to observe performance. Figure 8 shows that both Mid/Large- and Small-Cap long-only strategies decay more slowly than short-only, and advance events have higher momentum than delay events.
Finding 3: Signal is more pronounced for small caps
As mentioned in the previous two points, results were most profound for Small Caps, those companies with revenues below $250M. This is not surprising considering these companies have lower liquidity and are therefore more volatile in nature.
As demonstrated earlier in Figure 4, when using a long-short strategy to capture the price reaction for advancers and delayers on earnings release date across different aggregation windows and market caps, the 1-day aggregation window achieved the best results for both Mid/Large- and Small-Caps, but the latter’s Annualized Return of 19.7% was more than double that of the Mid/Large-Cap group.
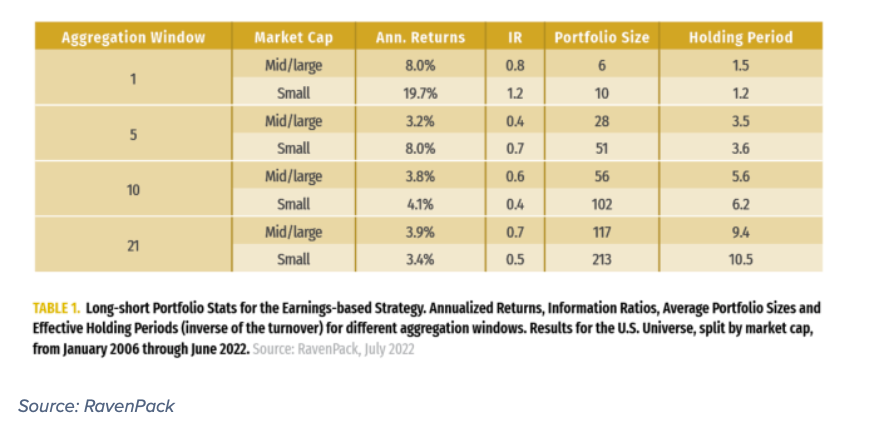
Table 1 shows the decay in AR and IR, for both groups, over longer aggregation windows.
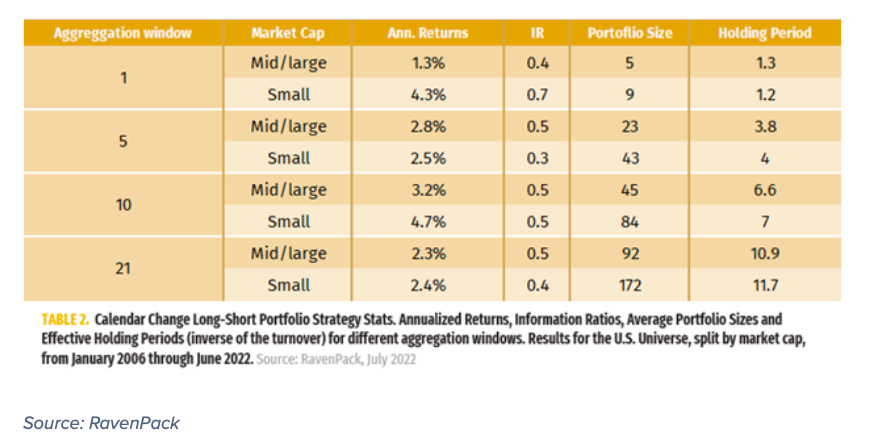
Again this is true when looking at the calendar change long-short strategy that measures stock movement in reaction to the earnings date change, before the quarterly report is released. While Small-caps continue to outperform here (and decay more slowly), Annualized Returns and Information Ratios are maximized at the 10-day aggregation window.
Finding 4: Advancers have more momentum over a longer period of time when looking at changes in events
Another significant finding of the RavenPack study was that advancers benefit from the signal over longer time periods, while the signal for delayers decays more quickly as determined by separating out long-only and short-only strategies.
Figure 8 shows the results of these separate strategies. Both Mid/Large- and Small-Caps long-only strategies decay more slowly than short-only, and advance events have higher momentum than delay events. This is consistent with findings from Figure 6 where the short-only strategy does not perform well, as delayed events do not deviate from zero significantly.
Finding 5: A combined strategy using earnings announcement events and earnings calendar change events performs best
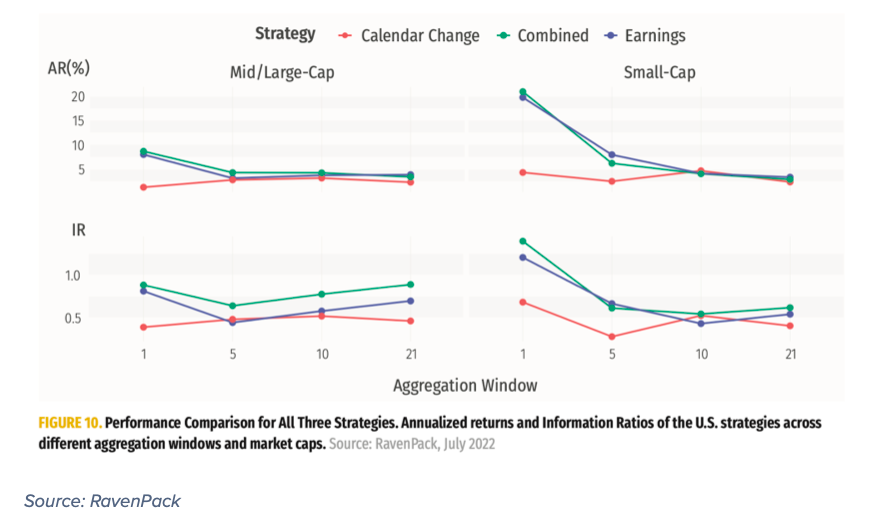
Combining the two strategies by utilizing both price movement in reaction to earnings calendar change events and earnings announcement events proved to perform best.
Figure 10 shows the comparison of the three strategies. In the Mid/Large-Cap universe, there is a noticeable improvement in Information Ratios across longer aggregation windows when using the combined signal. Within the Small-Cap universe, the performance enhancement is more modest; however Information Ratios remain relatively stable.
Additional Research
As other studies have demonstrated and the RavenPack study confirms, there is immense value in staying on top of corporate events like quarterly earnings reports, and their changes.
Another Wall Street Horizon proprietary metric that takes into account these important earnings announcement changes and therefore offers a view on corporate confidence is the Late Earnings Report Indicator, or LERI. It looks at the number of outlier earnings date confirmations and whether companies are confirming earnings dates that are later than they have historically reported, or earlier. The historical baseline for this indicator is 100, meaning that anything above this average suggests companies are confirming later earnings announcements and below this average indicates companies are confirming dates that are earlier. We’ve found that quarters that begin with a high LERI reading end up reporting lower S&P 500 EPS YoY growth than those with lower LERI readings.
“Corporate body language,” or the changes to these important market-moving events, is one of many cues that publicly traded companies can send to the market both intentionally and unintentionally. These non-verbal tells reveal a lot about a company’s financial health, and are very costly to miss.
For more information on the data sourced in this report, please email: info@wallstreethorizon.com
Wall Street Horizon provides institutional traders and investors with the most accurate and comprehensive forward-looking event data. Covering 9,000 companies worldwide, we offer more than 40 corporate event types via a range of delivery options from machine-readable files to API solutions to streaming feeds. By keeping clients apprised of critical market-moving events and event revisions, our data empowers financial professionals to take advantage of or avoid the ensuing volatility.

Christine Short, VP of Research at Wall Street Horizon, is focused on publishing research on Wall Street Horizon event data covering 9,000 global equities in the marketplace. Over the past 15 years in the financial data industry, her research has been widely featured in financial news outlets including regular appearances on networks such as CNBC and Fox to talk corporate earnings and the economy.
Twitter: @ChristineLShort
The author may hold positions in mentioned securities. Any opinions expressed herein are solely those of the author, and do not in any way represent the views or opinions of any other person or entity.
: Creating Bullish Divergence?")


 and Semiconductors (SMH): Concerning Price Pattern?")


