Friday’s trading session began with an oversold bounce. Although the markets weren’t near correction territory, they had been seeing a lot of selling lately. The S&P 500 Index (INDEXSP:.INX) was down 8 days in a row coming into Friday. So a bounce felt overdue.
Well, the S&P 500 kept its streak alive. Sellers returned by the afternoon and drove the index lower once more – 9 days in a row!
Throughout the day, we shared some excellent charts on our Twitter stream (and in articles here on the site). Here’s a taste of some important market charts and insights. Enjoy.
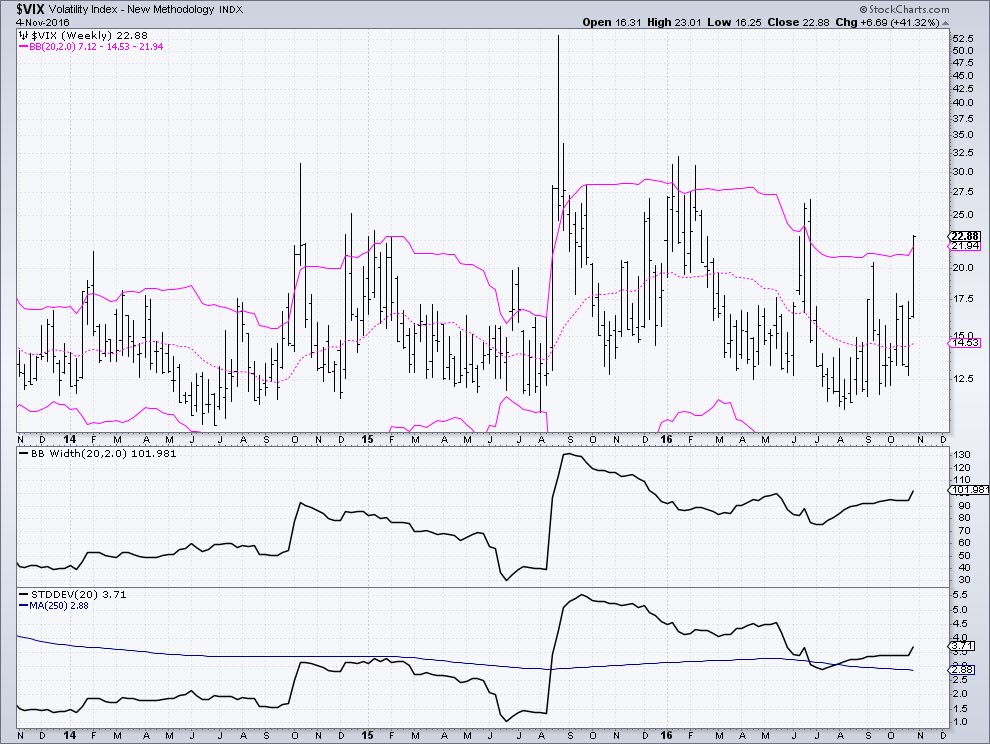
1). Steve Deppe (@SJD10304), a fellow See It Market contributor pointed out that the CBOE Volatility Index (INDEXCBOE:VIX) finished the week above it upper Bollinger Band. That’s a sign that fear is in the air…
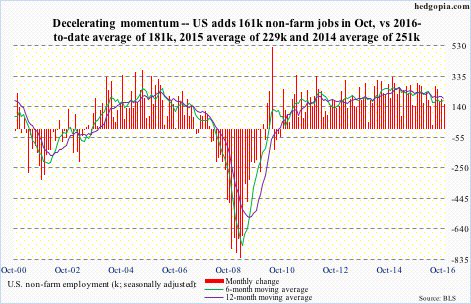
2). Paban Raj Pandey (@hedgopia) looked at the Friday jobs report and noted that the 161K in job adds wasn’t all that exciting. In fact, the 6 month average has been below the 12 month average for 7 straight months!
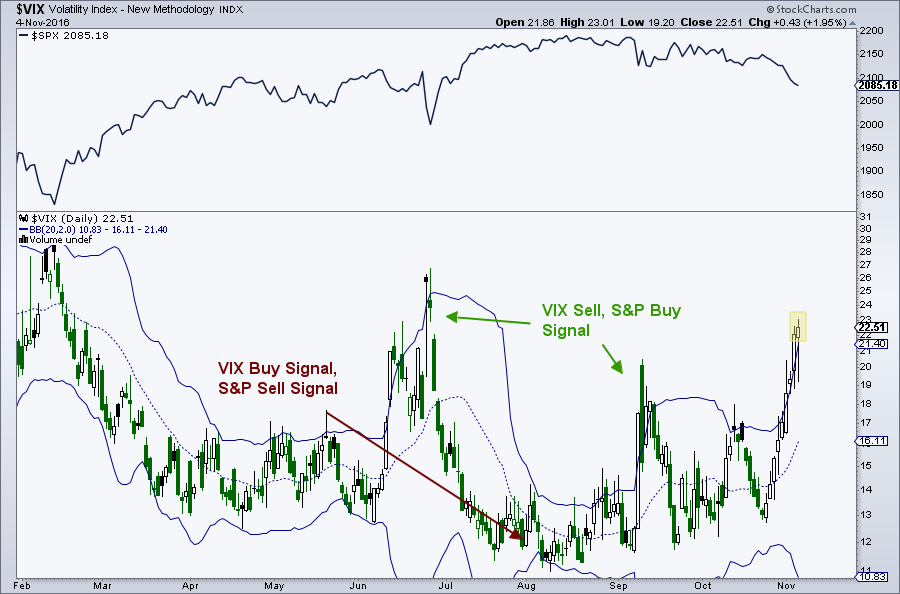
3). The Volatility Index (VIX) is shooting higher this week. Mark Arbeter highlights some past VIX sell signals (equity buy signals) and explains the 3-step process for a VIX buy/sell setup…
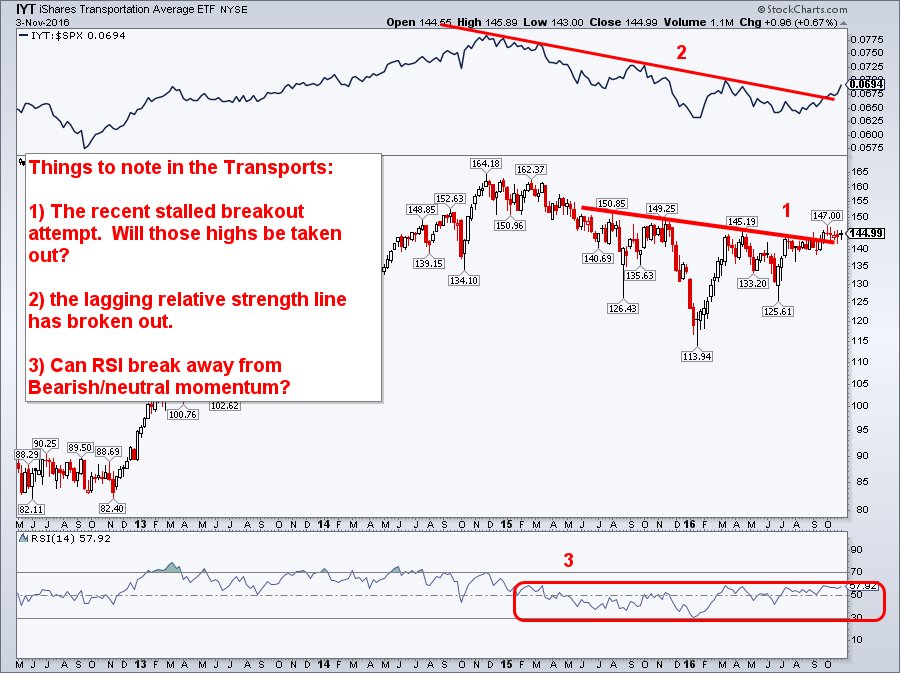
4). Aaron Jackson (@ATMcharts) continues to contribute some great charts to our stream. He points out that the Transports (NYSEARCA:IYT) are showing relative strength. If Transports can hold there own, perhaps the selloff is nearing an end… or close to it.
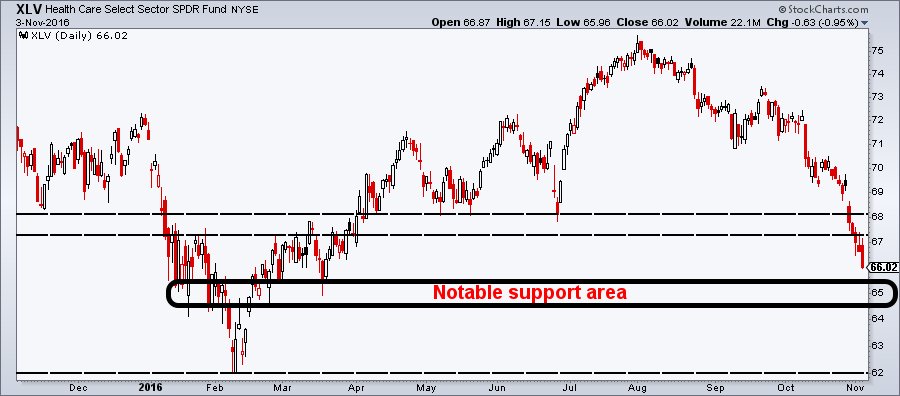
5). The Health Care sector (NYSEARCA:XLV) has been a mess lately. Aaron Jackson points out that the deep selloff may soon see a relief bounce as XLV is nearing notable technical support.
Thanks for reading and safe trading.
Twitter: @andrewnyquist
Any opinions expressed herein are solely those of the author, and do not in any way represent the views or opinions of any other person or entity.


 Ready To Break Out?")
")


