Investors bore witness to one of the largest stock market reversals on record since 07/08 last week. In sum, the Dow Jones Industrial Average (INDEXDJX:.DJI) recorded its best weekly gain in 5 years (and the S&P 500 in two years).
Last week was one for the record books… Not only did the US markets soar back to within striking distance of new highs (which did happen for DJIA) but did so in an amazing V-shaped fashion. And yet again, it seemed to catch most investors off guard. This market reversal also produced several bullish stock market indicators… I’ll cover that further below.
The initial plunge in stock market futures on election night saw markets drop nearly 6 percent from the highs down to their daily limit lows (-5 percent)… only to recoup the entire loss and then some. All together, the Dow Jones Industrial Average (DJIA) rallied over 1200 points from low to high. (While some ignore the DJIA given its price-weighting, it does have over a 90%+ correlation with the S&P 500).
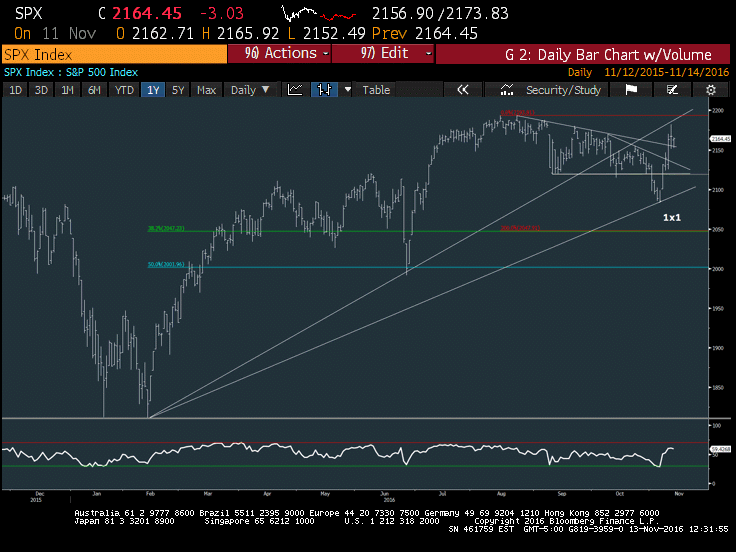
All in all, the S&P 500 has rallied nearly 8% (off those overnight lows) in the last three trading days, putting prices in near-term overbought territory, but on much firmer footing technically.
This post is a slice of Mark’s premium subscription research that went out this morning from Newton Advisor.
Why the Rally? Looking back, many scratch their head as to the reasons for the market plunge and recovery. And many are taking partisan stabs in saying with conviction that a Trump victory caused the decline, and others giving it credit for the rally. But who can say either with any real certainty? The fear of an uncertain world with high deficits and Trade protectionism, or the second coming of Ronald Reagan?
However, one thing is for certain: Those who banked on declines likely failed to cover their shorts at the lows. And many who pared back gains likely failed to buy into the rally after such a steep ascent from Midnight Tuesday night into Friday. As the saying goes, sometimes when the Horse bolts out of the barn and runs away, it’s proper to chase it. Those who hope that the horse comes back can often be disappointed and are then faced with a very difficult task of when to start the search party (i.e. re-enter the market at a much higher levels)
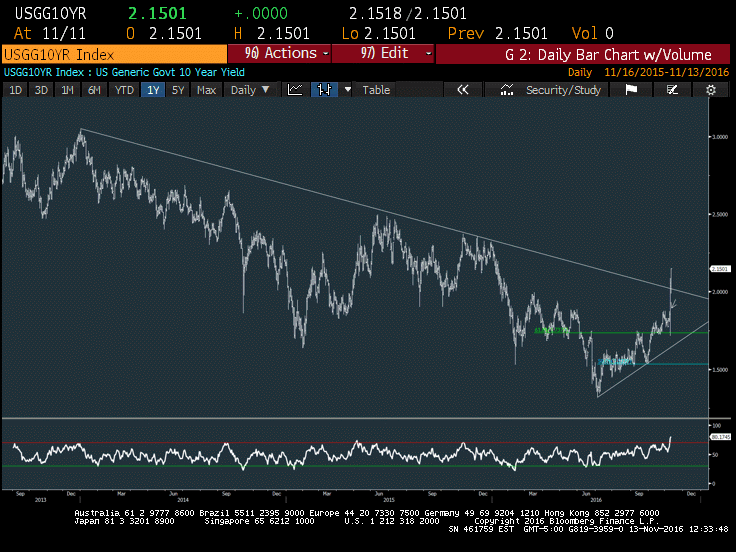
Lastly, the global bond market sell-off is also factoring in. And it’s been ugly. We’ll touch a bit more on this below.
Without further adieu, here are 5 bullish stock market Indicators which suggest additional gains still lie ahead:
1). The Russell 2000 breakout on an absolute and relative basis – Amazingly enough, the RTY has gained nearly 12% since 11/3, moving up sharply to the highest levels since July of 2015. This has helped Small-caps regain the trendline that was broken last month along with exceed the larger downtrend in the ratio of Small-caps /SPX which had been present since 2014.
2). 10, 30 year yield trend line breakouts from the last 3 years – This jump in yields has helped the yield curve steepen dramatically coinciding with a big surge in Financials, as might be expected. Though overdone at present, this is probably the most important technical development of the past week. Further gains into year-end are likely for Financials after a brief consolidation given the shift in momentum, which is positive given the Percentage of composition within the SPX.
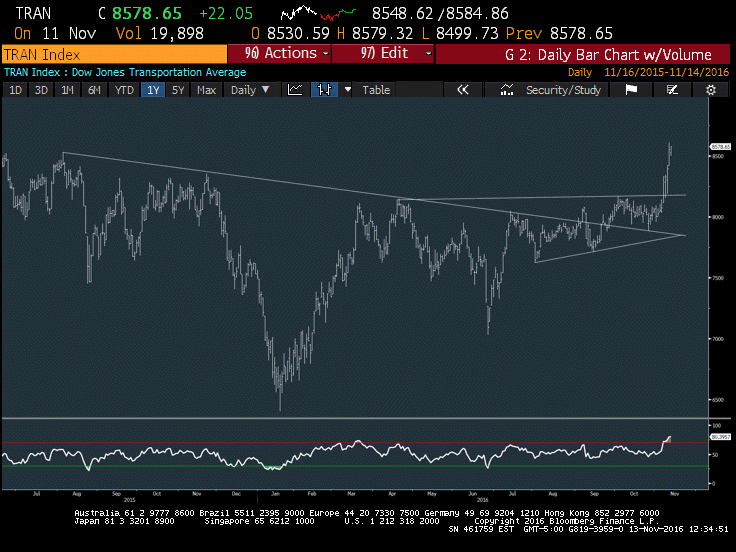
3). Breakouts in several Equity sector ETF’s and Indexes including Industrials, Financials along with Transportation – Looking over the last week, we saw impressive breakouts back to new multi-month highs for the Industrials- (XLI) along with Financials (XLF) while the DJ Transports exceeded former monthly highs to reach the highest levels for 2016 after a lengthy period of basing/consolidation. While many of these moves have made the sectors near-term overbought, they’re good structural moves which keep the indices bullish and are a driving factor to the Tailwind being seen right now in the Equity market despite the Technology weakness.
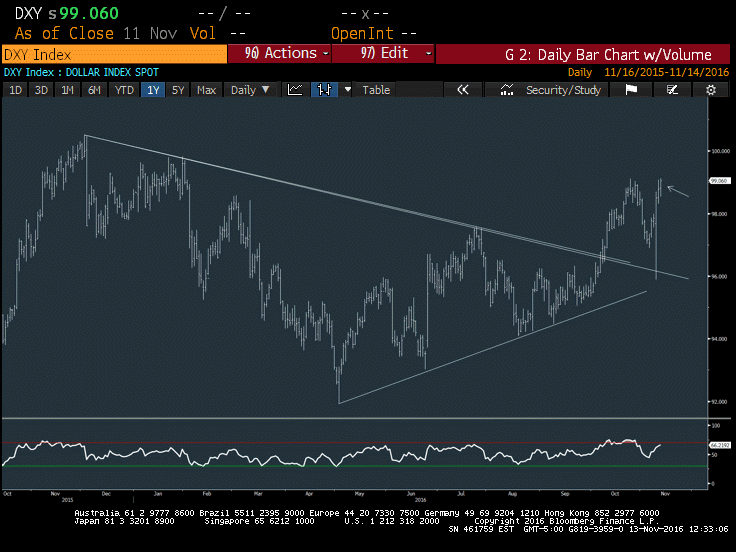
4). The US Dollar Breakout – This looks to be a real net negative for Commodities as seen in Precious metals plummeting last week along with WTI Crude falling to the lowest levels since early August. The DXY closed last Friday at the highest levels since January of this year, rising right up to test prior highs from October following just a minor pullback. This bullish technical action suggests additional US Dollar strength ahead.
5). The upward shift in Developed markets to Emerging markets – This happened largely because of the Dollar breakout, but is a positive shift for US Equities given that Emerging markets have largely outperformed most of the year. The Emerging market ETF, (EEM) broke down under the prior month’s lows along with severing a multi-month area of intermediate-term trendline support.
Lastly, here’s a look at the S&P 500 Index chart.
Thanks for reading.
Twitter: @MarkNewtonCMT
Any opinions expressed herein are solely those of the author, and do not in any way represent the views or opinions of any other person or entity.


