When treasury bond yields are rising, bond prices are falling. It’s an inverse relationship.
And so it makes sense that the 20+ Year Treasury Bond ETF (TLT) has fallen sharply during the Federal Reserve’s rate hike cycle.
“The Facts, Ma’am. Just the facts.” – Joe Friday
During the current rate hike cycle, the 10-Year treasury bond yield has risen to over 4.4%! And this has put pressure on treasury bond prices.
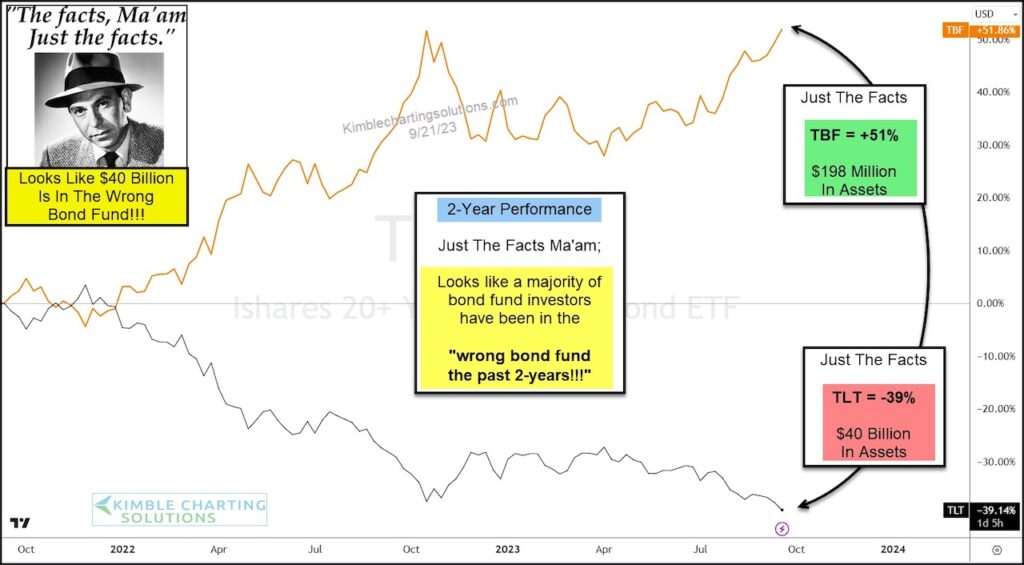
Today’s chart takes a look at the performance of one of the largest and most popular bullish (long) treasury bond ETFs, the 20+ year ETF (TLT) versus its counter part, the bearish (short) 20+ year treasury bond ETF (TBF).
As you can see, TBF (with only $198 million in assets) is up +51% over the past 2 years. In contrast, the much larger TLT (with $40 billion in assets) is down -39%.
Two Takeaways:
It would have paid to watch the trends and simply stay out of TLT over the past several months.
It also looks like the majority of the world (and $40 billion!) has been in the wrong bond fund the past 2-years!
$TLT versus $TBF Bond ETFs 2-Year Performance Chart
Note that KimbleCharting is offering a 2 week Free trial to See It Market readers. Just send me an email to services@kimblechartingsolutions.com for details to get set up.
Twitter: @KimbleCharting
Any opinions expressed herein are solely those of the author, and do not in any way represent the views or opinions of any other person or entity.


