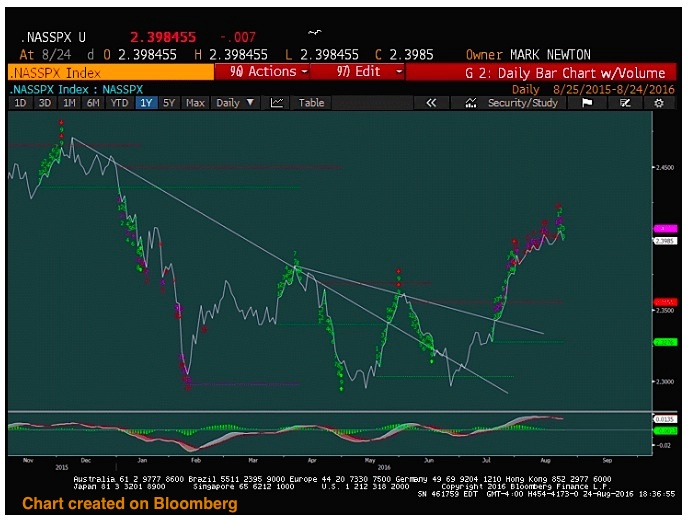
Wednesday’s selling was the first bearish sign for stocks in the last couple weeks. The S&P 500 (INDEXSP:.INX) undercut the lows of its most recent pennant formation which had been formed since early August. This could bring about a test of the mid-August lows and is viewed as a short-term negative for the stock market. As well, the Nasdaq Composite (INDEXNASDAQ:.IXIC) is looking “toppy” here.
Market breadth also finished at a bit over 2/1 in “Down” vs “Up” stocks, and volume picked up to the highest levels of the week thus far. While traders are in a holding pattern as we head into Jackson Hole, there are several cycles pointing to August 26 as having importance. Though early, this could mark a change in trend from a cyclical perspective.
A few things have emerged as concerns over the very near-term for stocks. And they were largely absent from the stock market last week. Namely, the Nasdaq (and select tech sectors) nearing exhaustion.
The following have me cautious near-term:
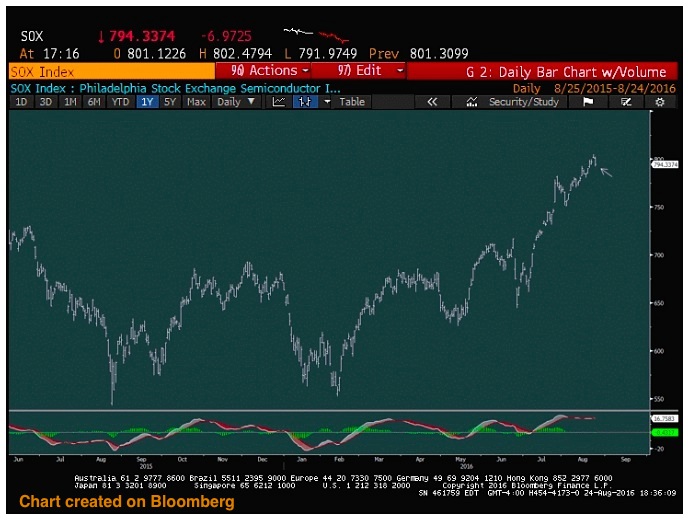
1) The NASDAQ Composite – The big tech index has shown a few signs that suggest this should now be topping relative to the S&P, and typically a concern and a leader in market movement, when the NASDAQ turns up or down prior to the SPX. Wednesday’s reversal occurred amidst a flurry of TD 13 signals from TD Sequential and TD Combo indicators on relative charts of NASDAQ Composite vs SPX. As well, the underperformance in the Semiconductors Index (INDEXNASDAQ:SOX) and drop to new multi-day lows could have a near-term detrimental effect on Semiconductor stocks and the Tech sector in general.
NASDAQ Relative Strength Chart… Topping?
NASDAQ’s close at the lowest levels since 8/10 look to be helping this ratio of NASDAQ Composite to SPX to turn lower at a time when two separate counter-trend sell signals are suggesting possible exhaustion for the NASDAQ vs SPX. Given that this turned higher and produced “buys” right at the lows in February and showed two prior indications of exhaustion both right within 2 days of prior peaks in April and also in early June, it’s worth paying attention to. In the days ahead, NASDAQ Composite should underperform the SPX, and technically it looks right to expect a relative correction in this ratio. Thus the NASDAQ should be the index to avoid between the two between now and early September.
2) Semiconductors (SOX) Reversal? The reversal in Semiconductors Wednesday also presents a near-term bearish development for the group after its huge run-up since February and more recently since June. The combination in this chart, similar to the NASDAQ/SPX, of a move to new multi-day low while counter-trend signals are abundant make Semis vulnerable to showing near-term weakness, and could underperform both Software and Hardware in the short run after a massive period of outperformance most of the year. While additional selling might be required for some to avoid this group from a trend following perspective, there’s sufficient evidence now from a counter-trend perspective to consider taking profits and avoiding in the near-term. Trading sells for the SOX would be confirmed on a Thursday 8/25 close beneath 797.05, or Friday 8/26 close under 797.28.
3) The Metals/Mining – This trade seems to have lost a lot of momentum in a very short period of time. GDX recently broke down out of its trend channel while Gold showed signs of violating support. Part of this is due to the attempted bounce in the US Dollar ahead of Yellen’s speech in Jackson Hole. While this move might prove short-lived given the Dollar’s ongoing downtrend and inconclusive proof of any rally, it’s notable that this sector has moved so quickly to the downside in the last few days after a lengthy period of prior outperformance.
4) Healthcare – The sector has also quickly reversed on the controversy regarding the recent “Epi-pen” price hike that was accentuated by Hillary Clinton on Wednesday afternoon. Prior to the sector’s about-face, Biotech’s ETF (NYSEARCA:XBI) had reached the highest level on a closing basis since January. However, by days end, XBI was right back at new weekly lows after a severe reversal. ENDP, MYL, MNK, and VRTX all shed more than 4% on the session after formerly being up more than 2%.
Thanks for reading.
Twitter: @MarkNewtonCMT
The author may have position in mentioned securities at the time of publication. Any opinions expressed herein are solely those of the author, and do not in any way represent the views or opinions of any other person or entity.


