Low Interest Rates, Broad-Based Strength and Sentiment Suggest Higher Prices for Stocks.
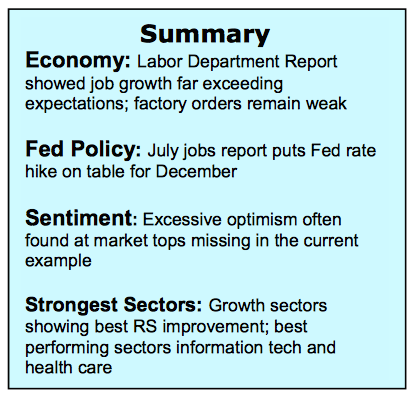
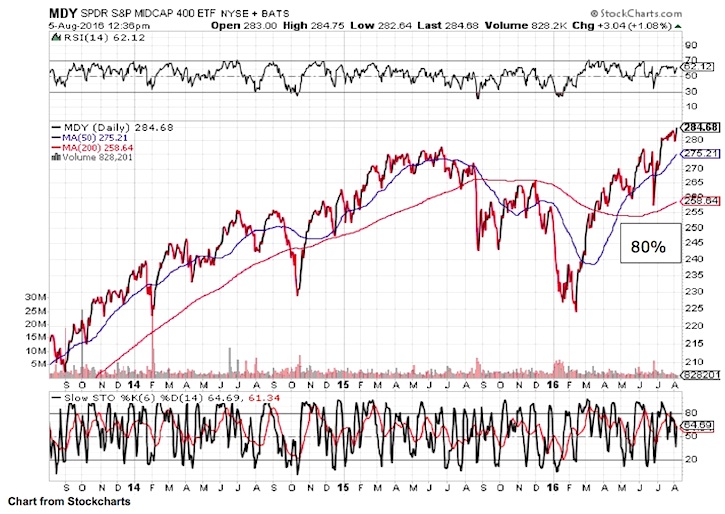
Major stock market indices gained ground last week following two weeks of drifting in a narrow trading range. Friday’s July jobs report provided the trigger for the rally carrying the S&P 500 Index (INDEXSP:.INX), the NASDAQ Composite (INDEXNASDAQ:.IXIC) and the S&P Mid-Cap Index to new all-time record highs. July’s increase of 255,000 jobs and the revised June number to 292,000 were the biggest back to back months for job increases in seven years.
The latest labor market report offsets the worrisome second-quarter GDP data and suggests that the much-expected improvement in corporate profits in the second half of the year is back on schedule.
Given that the Federal Reserve is not anticipated to increase interest rates due to concerns over Brexit and the weak first-half GDP statistics, stocks have for the moment the best of all worlds. From here the markets appear to be following the pattern of most election years. And several stock market indicators are supporting this.
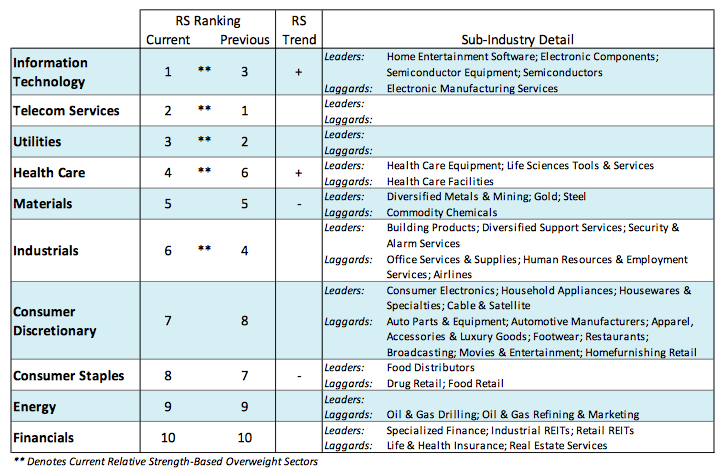
Historically, stock prices move higher in July and August followed by a correction in front of the election in September and October. The fact that defensive sectors have now taken a backseat to more growth sectors offers further evidence that the bullish trend will continue in 2016. Following a presidential election stocks typically rally in the second half of the fourth quarter regardless of the outcome. The strongest stock market sectors include information technology, materials and health care.
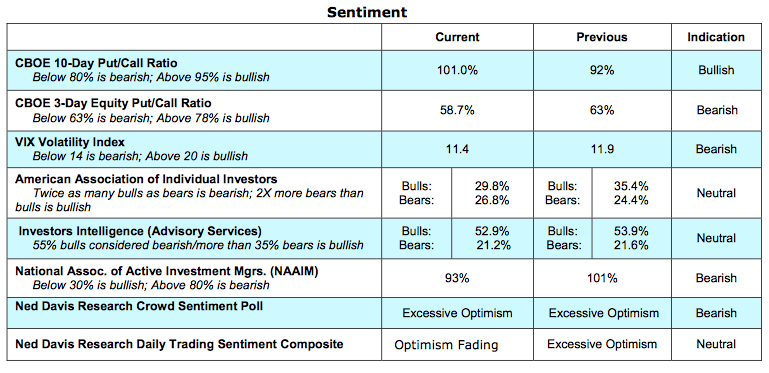
Let’s look at a few more stock market indicators. The technical condition of the equity market continues to point to higher prices. Stock market breadth improved again last week with the NYSE hitting new record highs and 83% of the industry groups within the S&P 500 in uptrends, up from 80% last week and a new cycle high. Stock market indicators relating to investor sentiment show little evidence of excessive optimism that is often found at market peaks. Investors have pulled nearly $70 billion from stock funds this year while net new inflows to bond funds soared to more than $135 billion. Using contrary opinion, this would argue that stocks have greater potential than bonds in the second-half of the year. Given the economy is anticipated to grow more than 2.5% in the third quarter, the economic fundamentals support the argument for stocks over bonds. The CBOE Volatility Index (VIX), which measures the level of investor fear, plunged to the lowest level in two years last week. But this is countered by the fact that the demand for put options was stronger last week than the demand for call options. It should also be noted that using the VIX as a sentiment indicator has a much better record in signaling important bottoms in the market than market peaks.
Thanks for reading.
Twitter: @WillieDelwiche
Any opinions expressed herein are solely those of the author, and do not in any way represent the views or opinions of any other person or entity.


