The following is a recap of the March 31 Commitment of Traders Report (COT) released by the CFTC (Commodity Futures Trading Commission) looking at Commitment of Traders data and futures positions of non-commercial holdings as of March 28.
Note that the change in COT report data is week-over-week. Excerpts of this blog post also appear on Paban’s blog.
3 Commitment of Traders Report Charts Looking At Spec Futures Positions in Crude Oil, Gold and the US Dollar
CRUDE OIL
Currently net long 411.4k, down 23.6k.
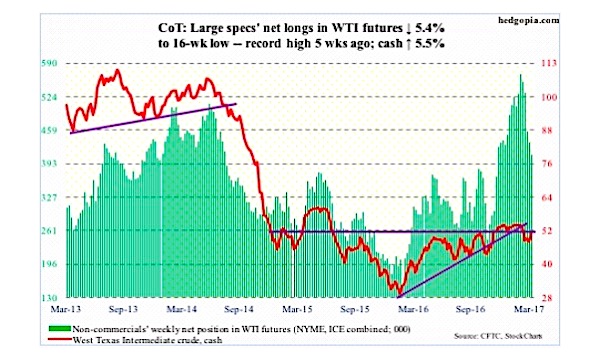
The $47 level on spot West Texas Intermediate crude was tested again Monday, and held. In the prior nine sessions, it was hit twice. The rally subsequent to this week’s test pushed the crude back above the 200-day moving average, rallying 2.4 percent on Wednesday alone. The EIA report out that day showed crude stocks continued to build, even as gasoline and distillate stocks continued to drop.
In the week ended March 24, U.S. crude inventory increased 867,000 barrels to 534 million barrels – yet another record.
Gasoline and distillate stocks fell by 3.7 million barrels to 239.7 million barrels and by 2.5 million barrels to 152.9 million barrels, respectively. In the last six weeks, gasoline inventory declined by 19.3 million barrels, and in the last seven distillates by 17.8 million barrels.
Crude imports fell, too, by 83,000 barrels per day to 8.2 million b/d. And refinery utilization increased 1.9 percentage points to 89.3 percent – a 10-week high.
In the meantime, crude production rose 18,000 b/d to 9.1 mb/d. Since OPEC reached a cutback agreement late November last year, U.S. production has gone up by nearly 450,000 b/d.
As for the WTI ($50.60), there is room for it to continue higher – as long as $47 remains intact, that is. Resistance is heavy at $51-$52. The 50-day lies at $51.72.
GOLD
Currently net long 137.8k, up 21.6k.
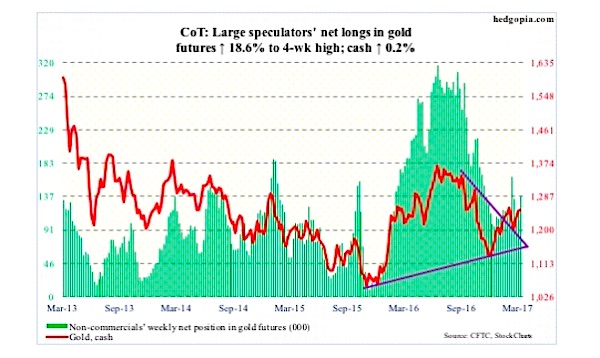
Once again, the 200-day moving average came in the way of Gold’s march higher, having rallied to $1,261.4 Tuesday before retreating. Same thing happened on February 27 when gold rallied to $1,264.9.
The yellow metal ($1,251.20) is caught between 50- and 200-day. Daily conditions are overbought. A test of the 50-day ($1,228.82) looks likely.
In the week ended Wednesday, the SPDR Gold ETF (NYSEARCA:GLD) lost $36 million (courtesy of ETF.com).
US DOLLAR INDEX
Currently net long 44.2k, down 2.1k.
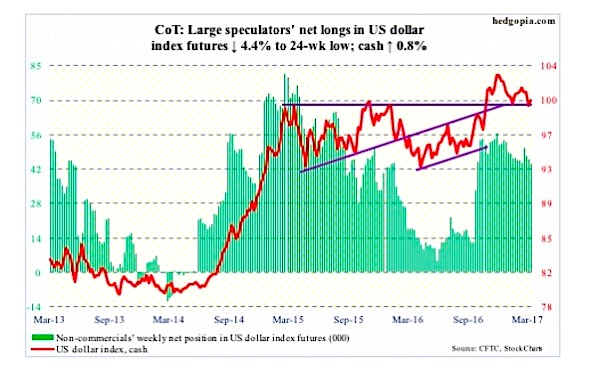
The US Dollar index rallied 0.3 percent on Wednesday, likely responding to interest-rate comments from Mr. Rosengren and Mr. Williams. A day earlier, it rallied 0.6 percent when Mr. Fischer spoke.
Last Monday, it just about tested the 200-day moving average. The low in that session (98.67) tagged the rising trend line from last May. Odds favor the dollar index (100.22) continues to rally – at least near term.
A crucial test lies ahead. The 50-day rests at 100.59, which is where horizontal resistance from March 2015 lies, and above that lies 102.
Thanks for reading.
Twitter: @hedgopia
Author may hold a position in mentioned securities at the time of publication. Any opinions expressed herein are solely those of the author, and do not in any way represent the views or opinions of any other person or entity.


