GREED AND FEAR
The January 1987 edition of Military Review, a professional journal of the U.S. Army, noted:
“Since the mind of the individual soldier has not changed and fear is the crucial factor in the outcome of all battles, tactics must be directed not just against the enemy, but also against fear.”
The same basic concepts apply to trading and investing; greed and fear have impacted trade for thousands of years. We all tend to get greedy at the same time and we all tend to become fearful at the same time. Thus, markets tend to follow similar patterns time and time again.
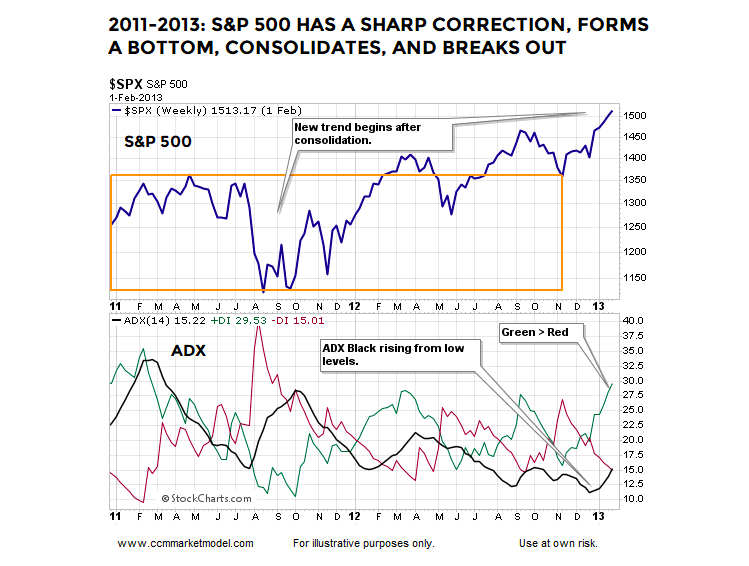
2011-2012 CASE
In 2011, stock market participants were concerned primarily about the European Debt Crisis. The S&P 500 Index INDEXSP: .INX dropped 19.39% before making a low on October 3.
With a gut-wrenching drop fresh in their minds, stock market participants remained skeptical even as data and market-related topics began to improve in 2012. The S&P 500 did not convincingly break out until learly 2013. Weekly ADX in the chart below helps monitor the strength and direction of a trend.
When Black ADX drops to low levels, as it did in December 2012, it tells us the market is in a trendless state. When Black ADX rises from low levels, as it was did in early 2013, it tells us a new trend may be emerging and the market may be waking up from a sleepy, trendless lull.
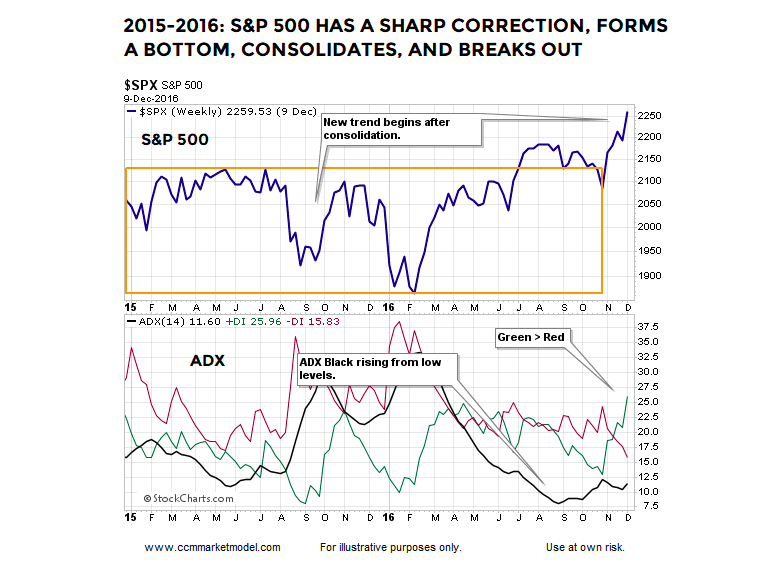
2015-2016 CASE
Market participants followed a similar greed/fear script in 2015-2016. With concerns about slowing growth, negative rates, and Brexit dominating the financial headlines, the S&P 500 ran out of gas in 2015 and eventually dropped 14.16% before making a low on February 11, 2016. The similar pattern in human behavior produced a similar setup to 2011-2012. After consolidating periodically in the first ten months of 2016, the S&P 500 finally broke out in a convincing manner during the last eight weeks of the year. Once again, Black ADX started to rise from low levels in 2016 (similar to 2012) and Green ADX popped above Red ADX, telling us the market was waking up from a lull and could be in the early stages of a new bullish trend.
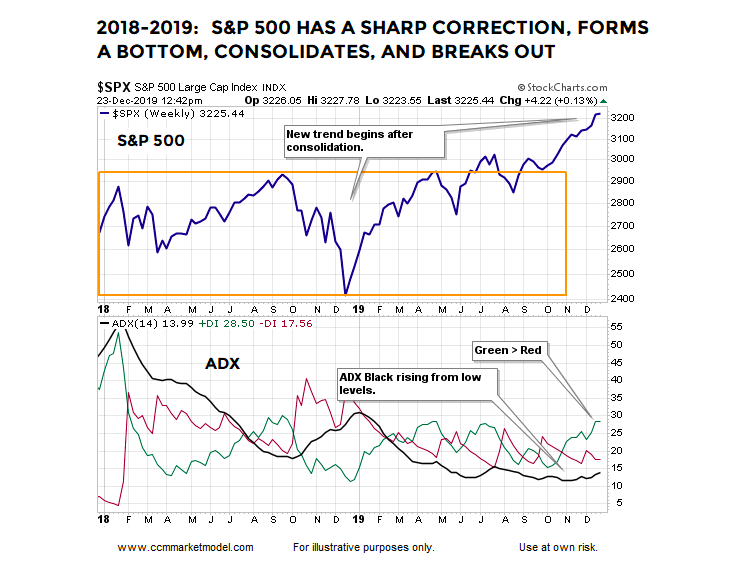
SIMILAR BEHAVIOR AND PATTERNS IN 2018-2019
In 2018-2019, market participants were concerned about Fed policy, slowing global growth, and the U.S./China trade war. The S&P 500 dropped 19.78%, allowing for the borderline silly “longest bull market ever” narrative to carry forward. Like 2012 and 2016, after the 2018 low, the S&P 500 experienced indecisive periods of consolidation in 2019 before breaking out in a convincing manner in Q4. Once again, Black ADX started to rise from low levels in 2019 and Green ADX popped above Red ADX, telling us the market was waking up from a lull and could be in the early stages of a new bullish trend.
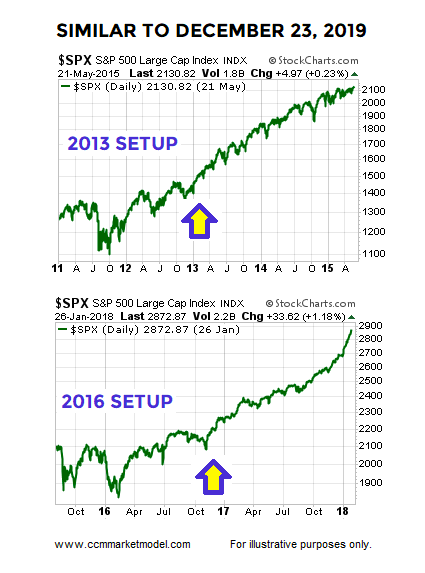
The two historical charts above are dated February 1, 2013 and December 9, 2016. Both periods are similar to December 23, 2019. As shown in the charts below, the S&P 500 performed quite well walking forward from February 1, 2013 and December 9. 2016, which tells us to remain open to better than expected outcomes in 2020.
2019 SIMILAR TO 1998?
You may have seen the case being made that 2018-2019 looks like 1998-1999. Does that theory align with the facts? You can decide after watching this week’s CCM video.
VIDEO
CONSUMER-DRIVEN ECONOMY
The unemployment rate is sitting near 50-year lows, which means more people are working and layoff data aligns with a still-strong labor market. Bloomberg reported Monday that consumers remain confident and they continue to spend:
Holiday shopping set records over the weekend, with Super Saturday sales reaching $34.4 billion, the biggest single day in U.S. retail history, according to Customer Growth Partners. “Paced by the ‘Big Four’ mega-retailers — Walmart, Amazon, Costco and Target — Super Saturday was boosted by the best traffic our team has seen in years,” said Craig Johnson, president of the retail research firm.
WEIGHT OF THE EVIDENCE
The weekly ADX setups covered above align with hard data covered in recent posts:
- Evidence Of A Broad Swing In Global Stock Momentum
- Global Dow Nails Down Bullish Signal
- Investors Run From Stocks At Record Pace
Twitter: @CiovaccoCapital
The author or his clients may hold positions in mentioned securities at the time of publication. Any opinions expressed herein are solely those of the author, and do not in any way represent the views or opinions of any other person or entity.


