Stocks keep making new highs, and corporate earnings keep getting downwardly revised.
That about sums up the current state of affairs in U.S. equities. With momentum as strong as it is, markets have turned a blind eye to multiples.
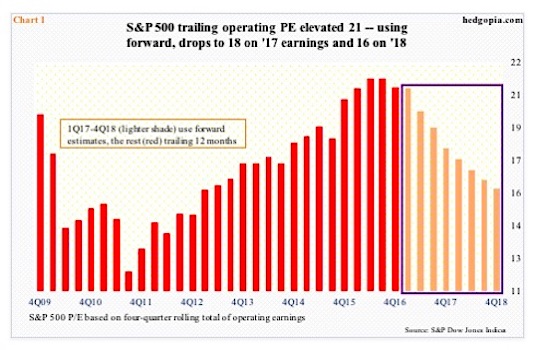
Consequently, the trailing price-to-earnings ratio on the S&P 500 large cap index (INDEXSP:.INX) has persistently expanded. Using four-quarter rolling total of operating earnings, 4Q16 P/E stood at 21, just slightly below 21.4 in 3Q16 (Chart 1 below), which was the highest since 26.7 in 3Q09. Back then, the economy was just coming out of Great Recession, and earnings were suppressed, hence the elevated P/E.
Fast forward to 2017 and the economy is growing – four months from completing eight years of recovery – but growth is subdued. And corporate earnings are stagnant.
With 87 percent of S&P 500 companies having reported earnings for 4Q, 2016 we currently sit at $106.86. This compares to $100.45 in 2015, $113.02 in 2014, and $107 in 2013. Flat as a pancake for three years. The S&P 500 closed 2013 at 1848.36. Last Friday, it was at 2351.16.
The resultant jump in P/E does not look as bad if we were to use forward earnings. Operating P/E contracts to 18x using $2017’s estimated $130.65 and to 16x using next year’s $146.98 (chart below).
But how realistic are these forward multiples? Not much is the short answer. Just look at the revision trend.
Somehow, this has become routine – start out with optimistic operating earnings estimates and bring out the knife as time passes. The majority tend to use forward estimates, which results in lower multiples at the time, and by the time these estimates are reduced, use next year’s estimates.
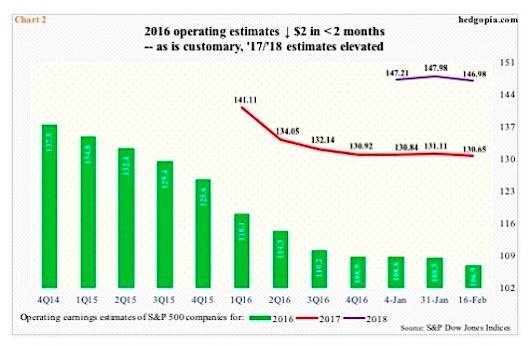
Back in February 2015, estimates for 2016 were as high as $137.50. On those earnings estimates, the S&P 500 traded at just north of 15 back then – not unreasonable. It is a different matter altogether that those estimates have now been cut down to just under $107. Since 4Q16 ended and as earnings season got underway, 2016 estimates have gone down by $2.
In keeping with this trend, estimates for both 2017 and 2018 remain elevated, although both have been cut a tad – 2017 from $141.11 in January last year to $130.65 now and 2018 from $147.21 last month to $146.98 (chart 2 below). (The latest data is as of last Thursday.)
As things stand, these estimates are as good as a pie in the sky – hence investor risk in using them as a valuation tool.
Speaking of valuations, here is another that jumps out at you.
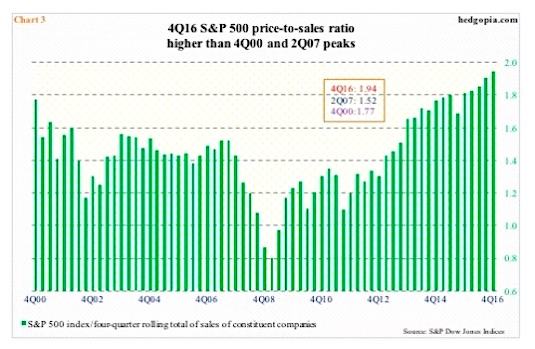
Chart 3 presents a price-to-sales ratio for the S&P 500 using trailing four-quarter running total of sales. Sales are expected to come in at $301.69 in 4Q16, for a four-quarter total of $1,151.16, hence a ratio of 1.94!
The green bars in Chart 3 (below) have been rising since 2Q09 and particularly since 4Q11. Nothing says the ratio cannot continue higher, but one thing is certain: There is something called mean reversion. With each move up in the ratio, risk of a reversal goes up more. Ditto with P/E.
Thanks for reading.
Twitter: @hedgopia
Author may hold a position in mentioned securities at the time of publication. Any opinions expressed herein are solely those of the author, and do not in any way represent the views or opinions of any other person or entity.


: Showing Some Signs of Emerging Strength")
