Tracking sector performance is one of the most important functions in my research and it is deeply imbedded into my broader macro work. Drilling down into each sector allows me to gauge the overall health of the U.S. Equities market. It also assists me in locating areas of the market that I want to focus my investment strategies on from a long, short and just plain “stay away” perspective. For more on my approach and to read my other 2015 sector outlook posts, click here.
This post will focus on the Financial Sector and Industrials Sector. As this is intended to provide a yearly outlook, the longer-term charts tend to drive my views as well as filter out some of the dust likely to be kicked up. Lastly, the use of sector ETFs just eases the implementation of any investment strategies one might seem fit. Note the Financials and Industrials can also be tracked and traded via Financial Sector SPDR (XLF) and Industrial Sector SPDR (XLI).
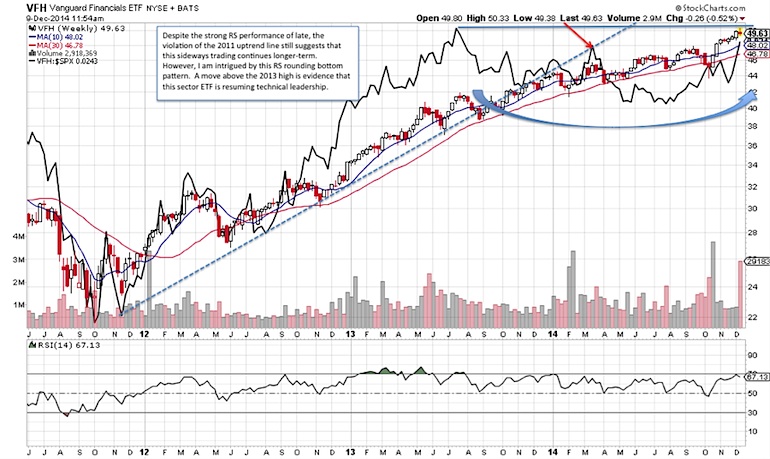
Financial Sector – Vanguard Information Financials ETF (VFH)
Despite the strong Relative Strength (RS) performance of late, the violation of the 2011 uptrend line still suggests that this sideways RS movement may continue for now. However, this RS rounding bottom pattern over the past year and a half intrigues me. A move above the 2013 high is evidence that this sector ETF is reemerging as a technical leader. A technical breakout could have bullish follow through well into 2015. Of note, there are other Financial sector ETF that looked poised to retest their respective 2013 RS highs ahead of VFH.
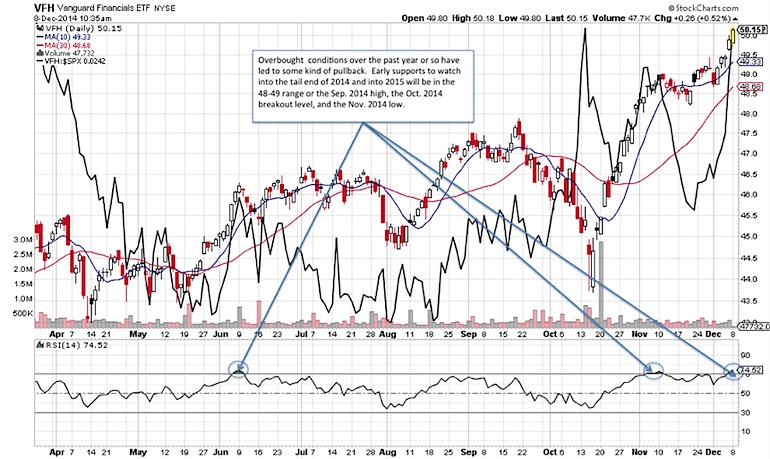
From a price perspective, continue to have an appropriate risk management strategy as an overbought condition and an early violation of its 2011 uptrend line suggest that one cannot invest blindly. Early supports to watch into the tail end of 2014 and into 2015 will be in the 48-49 range or the Sep. 2014 high, the Oct. 2014 breakout level, and the Nov. 2014 low. The ability to maintain this support on pullbacks could set the stage for the next rally higher.
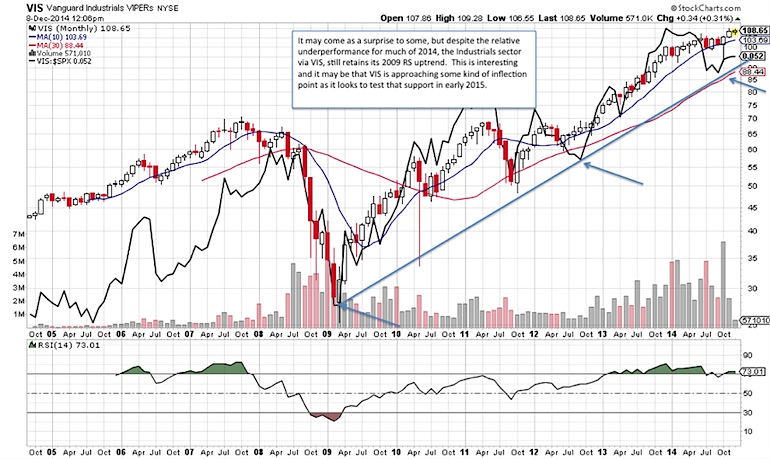
Industrials Sector – Vanguard Industrials ETF (VIS – Quote)
It may come as a surprise to some, but despite the relative underperformance for much of 2014, the Industrials sector via VIS, still retains its 2009 RS uptrend. This is interesting and it may be that VIS is approaching some kind of inflection point as it looks to test that support in early 2015. A violation of that support could be the beginning of a sustainable avoidance of the sector ETF versus other areas of the market. On the other hand, the ability to maintain this RS support could be the result of a sector rotation as VIS begins a period of outperformance.
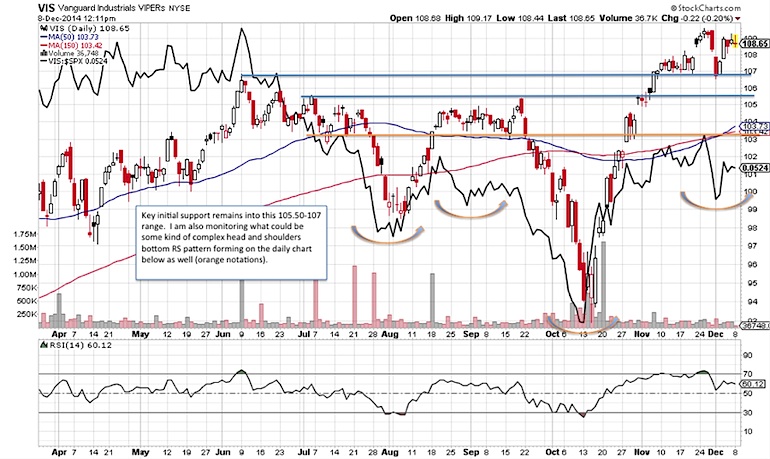
Key initial support remains into this 105.50-107 range. I am also monitoring what could be some kind of complex head and shoulders bottom RS pattern forming on the daily chart below as well (orange notations).
Thanks for reading. Best to you with your investing in 2015.
Follow Jonathan on Twitter: @jbeckinvest
No position in any of the mentioned securities at the time of publication. Any opinions expressed herein are solely those of the author, and do not in any way represent the views or opinions of any other person or entity.


