This week we have featured the 23-month moving average or 2-year business cycle and its significance to the indices.
Particularly when writing about the S&P 500, we wrote:
There was a bullish run in 2021 based on easy money. Inflation ran hotter than most expected. The Central banks were caught off guard…and by 2022..party was over.
So, that really begs the question of why is this year’s 23-month moving average one of the most important indicators for equities?
Now, what about for gold?
Anybody who has followed us knows how bullish we are in the metal. And, after hearing the State of the Union Address Tuesday night, we are even more bullish now. Those thoughts will be published over the weekend as an addendum to the 2023 Outlook.
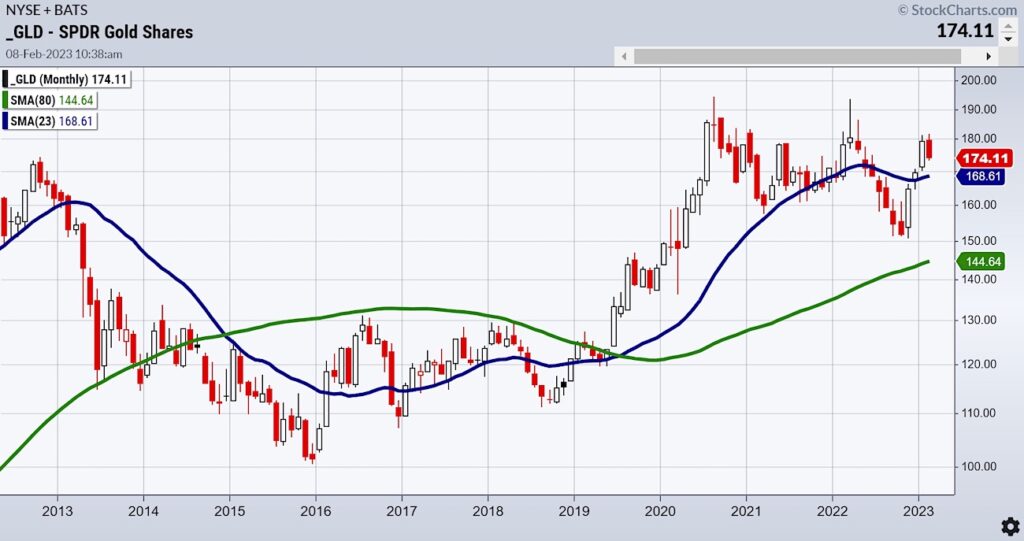
Let’s look at the monthly chart of gold.
The charts of the SPY and the Russell 2000 (IWM) both showed how they stopped rallying right under the 23-month MA. That could change of course.
Gold on the other hand, is above the 23-month MA and the 2 year business cycle.
It cleared the major moving average in December. Saw follow through in January 2023. And thus far, in February, is holding the gains.
In fact, should gold get closer to around 168-170, that would look like a low risk buy opportunity.
If SPY and IWM cannot clear their 2-year cycles, while gold already has-watch the charts. They tell you everything.
Stock Market ETFs Trading Analysis & Summary:
S&P 500 (SPY) 420 resistance with 390-400 support
Russell 2000 (IWM) 190 now support and 202 major resistance
Dow (DIA) 343.50 resistance and the 6-month calendar range high
Nasdaq (QQQ) 300 is now the pivotal area
Regional banks (KRE) 65.00 resistance
Semiconductors (SMH) 248 is the 23-month moving average-key
Transportation (IYT) The 23-month MA is 244-now resistance
Biotechnology (IBB) Sideways action
Retail (XRT) 78.00 the 23-month MA resistance and nearest support 68.00
Twitter: @marketminute
The author may have a position in mentioned securities at the time of publication. Any opinions expressed herein are solely those of the author and do not represent the views or opinions of any other person or entity.


