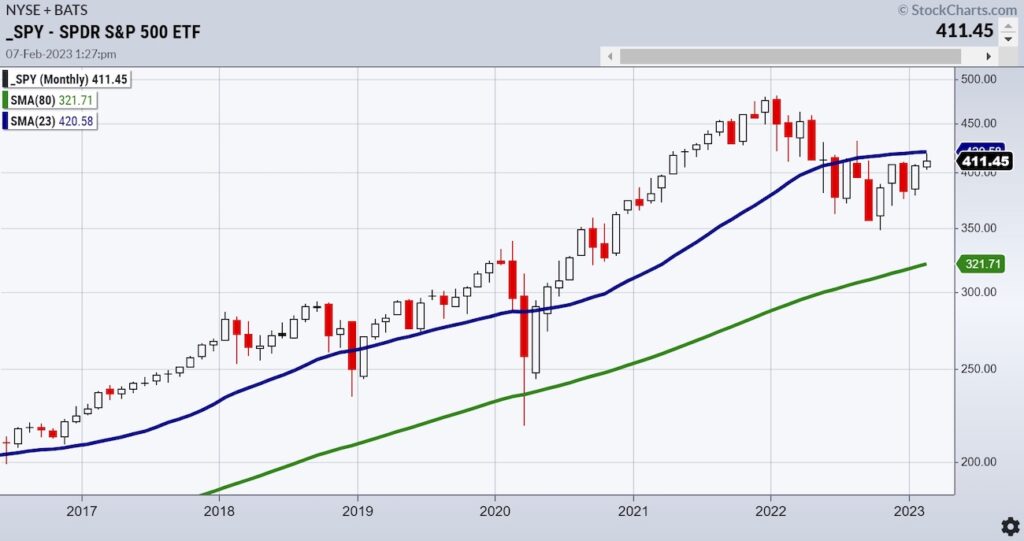
Some of you might have already heard us speak about the monthly moving averages or have read our commentary about their significance.
Monday we asked, “What if the trading range top at 4200 we have been calling for in the S&P 500 turns out as—the top?”
Then, on Fox Business, Making Money with Charles Payne, I discussed the 2-year business cycle.
Today, we show you the charts on how that business cycle looks.
A 2-year or 23-month moving average in blue is at the very least, interesting.
What has happened in the last 2 years?
A bullish run in 2021 based on easy money. Inflation running hotter than most expected. The banks caught off guard…and by 2022… party over.
So, that really begs the question of why is this year’s 23-month moving average one of the most important indicators for equities?
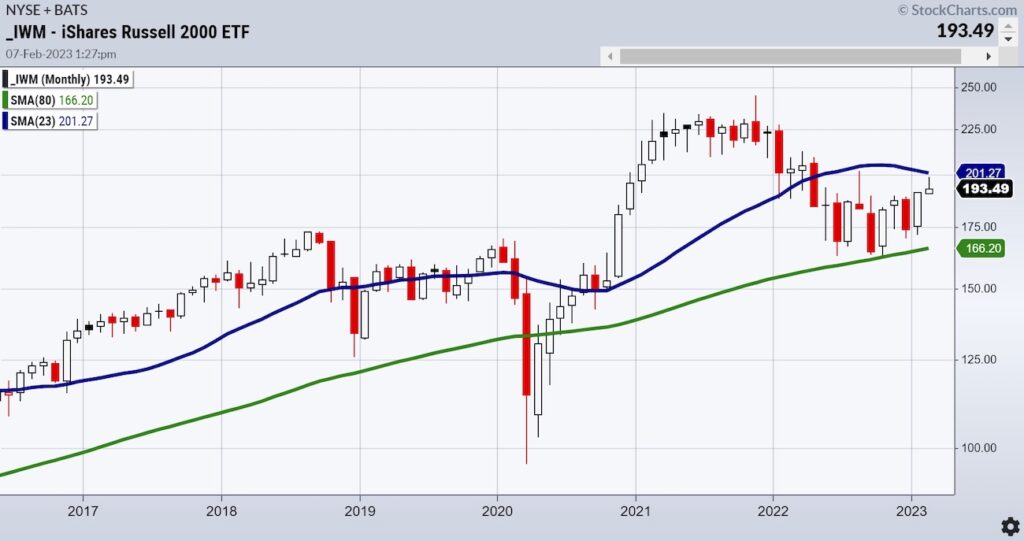
Here is the Russell 2000 (IWM). Even cleaner perhaps.

As Granddad of the Economic Modern Family, a break and close over the 23-month MA would be enough evidence to believe soft landing and good news for the economy and market.
A failure to pierce that MA means chop. A break of the also majorly important 80-month MA (green) that represents a 6-7 year business cycle-bad..very bad.
In October, IWM held the 80-month and got us believing that a recession would be averted.
Now, the market literally hangs in the balance between a longer term and a shorter-term business cycle.
Trust the charts and know your timeframe.
Stock Market ETFs Trading Analysis & Summary:
S&P 500 (SPY) 420 resistance with 390-400 support
Russell 2000 (IWM) 190 now support and 202 major resistance
Dow (DIA) 343.50 resistance and the 6-month calendar range high
Nasdaq (QQQ) 300 is now the pivotal area
Regional banks (KRE) 65.00 resistance
Semiconductors (SMH) 248 is the 23-month moving average-key
Transportation (IYT) The 23-month MA is 244-now resistance
Biotechnology (IBB) Sideways action
Retail (XRT) 78.00 the 23-month MA resistance and nearest support 68.00
Twitter: @marketminute
The author may have a position in mentioned securities at the time of publication. Any opinions expressed herein are solely those of the author and do not represent the views or opinions of any other person or entity.


