There has been a lot of chatter about interest rates. And investors would love to have clarity on this issue.
But, it’s almost better as it is. Stocks like to climb a wall of worry.
If rates head lower, then it might signal that the economy is struggling.
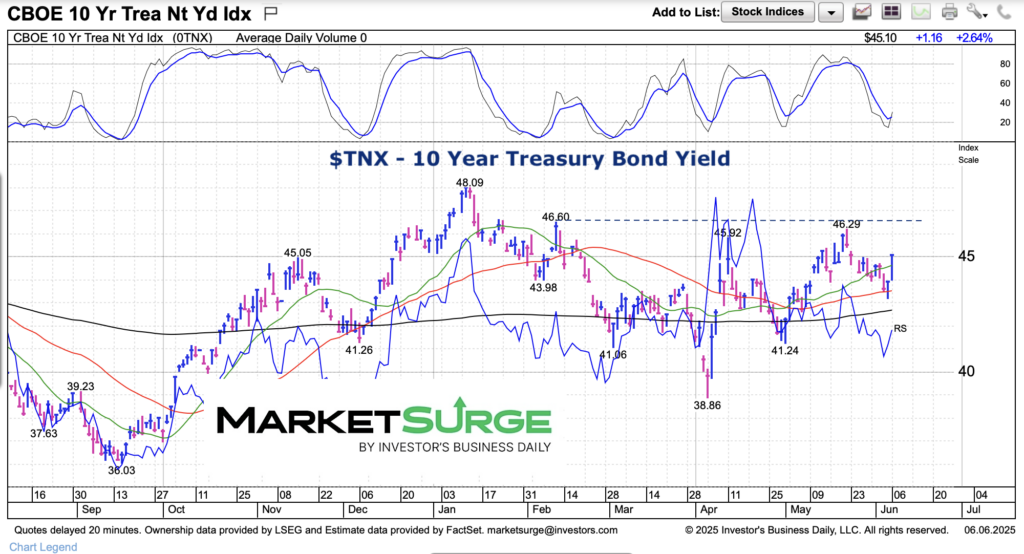
Nevertheless, President Trump wants interest rates lower and continues to rail on Fed Chairman Jerome Powell. Today we look at the chart of the 10-year treasury bond yield and highlight why it’s in a sideways pattern.
Note that the following MarketSurge charts are built with Investors Business Daily’s product suite.
I am an Investors Business Daily (IBD) partner and promote the use of their products. The entire platform offers a good mix of tools, education, and technical and fundamental data.
$TNX 10 Year Treasury Bond Yield Chart
Plain and simple, prior highs have created resistance around 4.6% to 4.65%. Barring a jump in inflationary pressure, this could cap any rally and keep rates in a sideways pattern (4.0% to 4.65%).
Twitter: @andrewnyquist
The author may have a position in mentioned securities at the time of publication. Any opinions expressed herein are solely those of the author, and do not in any way represent the views or opinions of any other person or entity.
: Creating Bullish Divergence?")


 and Semiconductors (SMH): Concerning Price Pattern?")


