There is a dichotomy between U.S. sales of new and existing homes. This has been preceded by a dichotomy between how their median prices were diverging from each other.
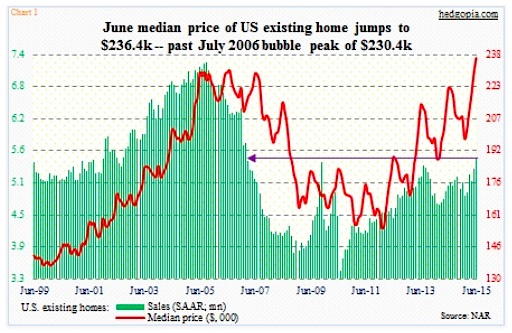
June saw existing home sales jump to a seasonally adjusted annual rate of 5.49 million units – the highest since 5.79 million in February 2007 (see chart 1 below). New home sales, however, fell to a seasonally adjusted annual rate of 482,000 in June – a seven-month low. New home sales peaked this February at 545,000, which was the highest since 593,000 in February 2008 (see chart 2 below).
As Charts 1 and 2 show, current home sales, not surprisingly, are substantially below the bubble highs of a decade ago. At the peak, sales of existing homes reached 7.26 million in September 2005, and new homes 1.39 million in July that year. Off the lows, the recovery has been slow and steady – existing home sales reached a low of 3.45 million in July 2010, and new home sales 270,000 in February 2011.
From this perspective, it is hard to reconcile the rapid post-bubble recovery in home prices. Charts 1 and 2 also show the divergence between home sales and median prices in both categories – particularly in Chart 2.
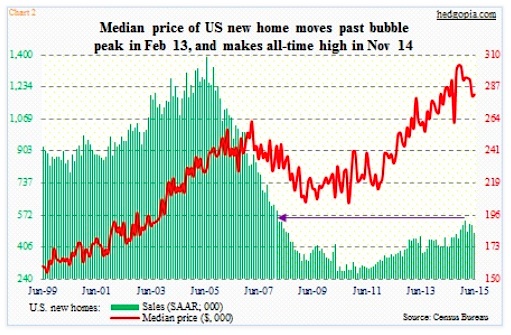
The median price of a new home peaked at $262,600 in March 2007; sales were still coming in strong at 833,000 units then. That price point was surpassed in February 2013, even though home sales by then had dropped to 439,000 units. The median price continued to rise, peaking at $302,700 in November last year. June was $281,800.
On the existing front, during the bubble the median price peaked at $230,400 in July 2006; at the time, 6.31 million homes were sold (SAAR). That record was only broken last month; June came in at $236,400. As stated earlier, 5.49 million homes (SAAR) were sold last month.
Two things are worthy of note here.
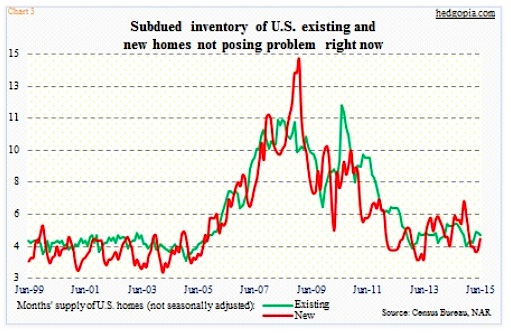
One, post-bubble, price appreciation has far superseded sales activity. Inventory remains well behaved. Months’ supply in June was five and 4.8 for existing and new homes, respectively (chart 3 below). Versus where they have been, these are subdued levels, and probably exert upward pressure on prices although sales are mediocre.
And two, the path of price appreciation between the two has taken on diverging paths. Between the July 2006 peak and the January 2012 trough, the median price of an existing home fell 33 percent (Chart 1 above). And between the March 2007 peak and the October 2010 low, the median price of a new home only fell 22 percent, bottoming much earlier (chart 2 above).
The bigger question is if the price spike is impacting home sales, or if it has potential to do so.
First of all, monthly home sales tend to be volatile, as can be seen in the first two charts above. One way to adjust for this volatility is to simply calculate a rolling average, which is what Chart 4 does. Using this methodology, June sales of both new and existing homes were at a post-bubble high – 484,000 and 5.1 million units, respectively. That is the good thing.
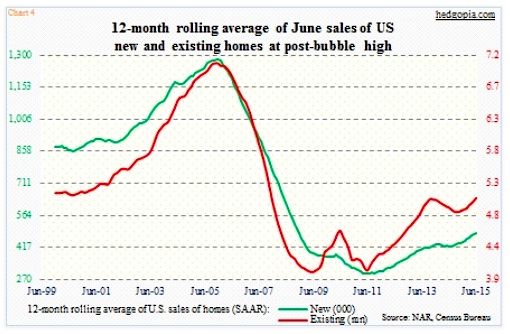
That said, the three-month average of sales has diverged, with new homes peaking at 520,000 in February and existing homes reaching a post-bubble high of 5.3 million units in June (not shown here). At least going by what we have so far, momentum is coming out of new home sales.
The possible culprit? Once again, referring back to chart 2 above, the median price of a new home spiked into the November 2014 peak. The red line in that chart has dropped seven percent since that peak, but the spike seems to have done the damage. Sales peaked in February.
In this regard, the June spike in the median price of an existing home is worth paying attention to. How long before it begins to impact sales?
Tomorrow, the Pending Home Sales Index for June is released. In May, it rose for the fourth straight month, reaching the highest level in nine years. The index is based on signed contracts for existing homes, and tends to lead sales by a month or two. It is worth paying attention to. Particularly so this time around.
Thanks for reading!
Twitter: @hedgopia
Read more from Paban on his blog.
Any opinions expressed herein are solely those of the author, and do not in any way represent the views or opinions of any other person or entity.


