October was an eventful month as stock markets rebounded from their September selloff, oil prices stabilized somewhat, and the employment picture in the U.S. continued to firm a bit.
On October 6th the IMF revised its forecast for global growth this year to 3.1%, down from 3.3%, citing an emerging markets slowdown, driven largely by falling commodity prices. The IMF also reduced its 2016 forecast from 3.8% to 3.6%.
Let’s look at the U.S. and Global capital markets.
Stocks & Bonds
The S&P 500 rebounded strongly in October, even though the month of Halloween is often a weak month for stocks. The Chinese stock market continues to rebound, as there is a continuing question of yuan inclusion in the IMF ‘global currency’ – strategic drawing rights or SDRs.
This has likely helped support the yuan, and thereby China’s capital markets, at least for the time being. The Fed continues to rattle its saber about raising rates.
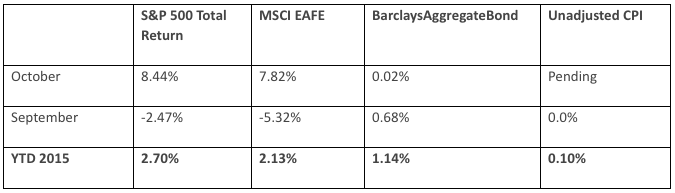
A look at the capital markets, by the numbers:
Commodities & Currencies
NYMEX crude oil prices were volatile in October, although they ended essentially flat for the month and are still down about 25% year-to-date. Market commentators continue to point out record amounts of crude held in storage around the world, and worry about an oversupplied market. A continuing surprise is that U.S. crude oil production has remained strong, even though analysts initially thought that U.S. fracking producers, a more expensive form of production, would be hit hardest by falling prices. The U.S. Dollar index rose almost imperceptibly in October, and for the year is up just over 5%.
Other foreign economies including the yen and the euro continue with their own currency devaluations, driving the U.S. Dollar relatively higher. Gold fell 2.35% in October and is down just over 5% year-to-date. On a side note, I watch iron ore exports from Port Hedland, Australia quite closely. Australia is the world’s largest exporter of iron ore, the central component to steel-making, and Port Hedland is one of their largest export terminals. Port Hedland iron ore exports fell year-over-year in October for the first time in several years. The decline was modest, about 4%, but the reversal in change was somewhat noteworthy.
Economy
The ISM Manufacturing PMI in September came in at 50.1, showing a very slight expansion, although the pace of expansion continues a months-long fall. The sub-index of exports rose to 47.5 from 46.5, an improvement, but still indicating contracting exports. This could be a market ‘tell’ to watch for the capital markets. The sub-index of imports also indicated contraction, reading 47, a market change from the previous month’s reading of 50.1. The unemployment rate fell in October to 5.0%, from the previous month’s 5.1%, and wage growth showed signs of picking up, at least in the industries of retail and restaurants. The labor force participation rate is now at 62.6%, its lowest reading since the 62.4 percent of October 1977.
Summary
The chart below does an excellent job of showing the disparity between the U.S. stock market and commodity and bond markets. Over the last 5 years, global yields have fallen and commodity prices have fallen, indicating slowing global demand and financial activity. Meanwhile, the U.S. stock market continues to rise, indicating continued global growth.
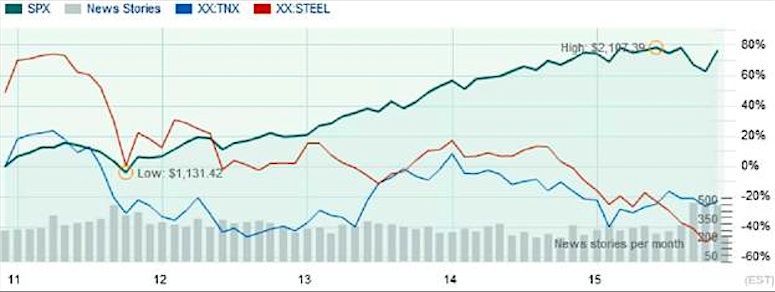
The red line indicates prices for steel, a basic component of construction and industry. Movements in its prices give a strong indication of real world economic activity. Prices were over $2,000 per tone in 2011, and are today around $650 per tonne. Even more striking is the fall since the middle of 2014, losing half of its value in approximately 18 months. This also indicates that the ‘slowdown’ in China, one of the world’s largest producers and consumers of steel, is much more severe than official government numbers indicate. The blue line shows the 10-Year U.S. Treasury yield. Yields fall as investors move to the safety of the U.S. Treasury and dollar market, and this chart shows that the yield has fallen by just over 20% in the last 5 years. It has not been without volatility, but still, falling yields corroborate the weakening economy indicated by plummeting steel prices.
Meanwhile, the U.S. stock market has nearly doubled in value, indicating continued and strong economic growth.
One of these markets is not like the others. And I should add that the strength in the U.S. stock market is not nearly as robust if the chart were a 10-year timeframe, since much of the growth in the last 5 years has come after the historic selloff of 2008 and 2009 and the disruption that the financial crisis caused in the capital markets.
At the same time, I believe that the stock market faces stronger headwinds in the next year or two than most pundits believe. The strengthening dollar will continue to adversely impact corporate profits, which could hurt stock valuations. And further yuan devaluation as part of China’s ongoing recession could at some point cause a credit crisis with contagion into global equity markets. Long-term, I do not believe that equities are over-valued, but I think that they are certainly vulnerable to some of the near-term economic realities that are already appearing in bond and commodity prices.
Thanks for reading.
Data Sources:
- www.standardandpoors.com – S&P 500 information
- www.msci.com – MSCI EAFE information
- www.barcap.com – Barclays Aggregate Bond information
- www.bloomberg.com – U.S. Dollar & commodities performance
- www.realtor.org – Housing market data
- www.bea.gov – GDP numbers
- www.bls.gov – CPI and unemployment numbers
- www.commerce.gov – Consumer spending data
- www.napm.org – PMI numbers
- www.bigcharts.com – NYMEX crude prices, gold and other commodities
- www.bigcharts.com – Chart showing contrast between U.S. stock market as measured by the S&P 500, steel prices as measured by the NYSE Steel Index, and the yield on the 10-Year U.S. Treasury Bond.
Any opinions expressed herein are solely those of the author, and do not in any way represent the views or opinions of any other person or entity.


 Ready To Break Out?")
")


