 By Andrew Nyquist
The past 2 years have seen uranium stocks crater and flatline. Much of that has to do with the tragic Japanese earthquake on March 11, 2011. The earthquake crippled nuclear reactors and left many people at risk. And with each twist and turn, the news cycle seemed to extend a bit longer, furthering the downward pressure on uranium stocks. By the time the news cycle ended, the damage had been done. And uranium stocks were nearly untouchable from an investment standpoint. Months later now, the sector is showing some tenuous signs of life. And one stock that could lead the recovery charge is Cameco (CCJ).
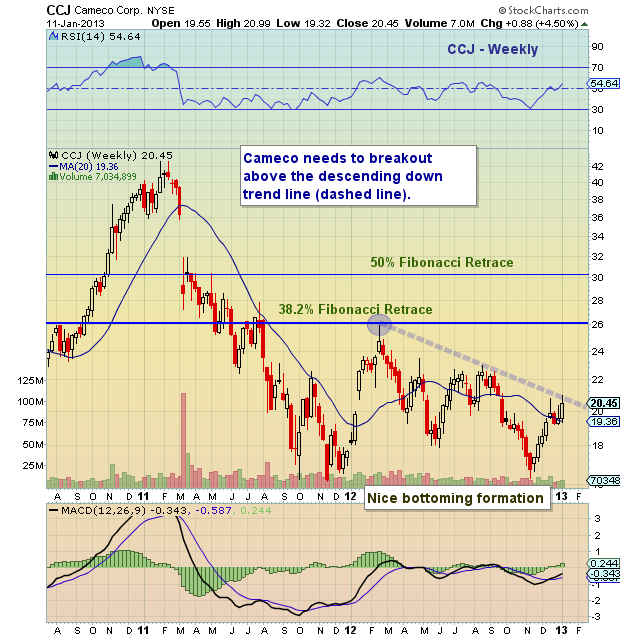
Looking at the chart below, one can see the initial retrace to the 38.2 Fibonacci level that failed in early 2012. This move was very quick and very technical. It was notably bearish in that it left a long topping tail, indicating that it wasn’t ready to actually challenge the important fib level.
Fast forward to today, and the stock is trying to carve out a bottoming pattern. Price is pushing up against downtrend resistance. And, investments aside, Cameco may offer a near-term opportunity for traders IF the stock can break above the weekly down trend line (dashed). This is a big challenge and cases can also be made for traders to go (or stay) short into the resistance (covering on breakout above). In summary, the short-term toggle for bulls and bears appears to be $21.00; bullish above, bearish below.
Trade safe, trade disciplined.
Twitter: @andrewnyquist and @seeitmarket
No position in any of the securities mentioned at the time of publication.


