The VIX Volatility Index (INDEXCBOE:VIX) is back in the headlines. Also known as The Fear Index, the VIX is arguably the most over-analyzed tool on Wall Street regarding its real-world predictive powers relative to the long-term path of the stock market (i.e. the S&P 500 Index: INDEXSP:.INX).
Today we’ll spend some time expanding on this and point to some historical examples.
The common argument is when the Volatility Index (VIX) spikes, it is indicative of rising fear, and thus stocks typically drop when the Volatility Index rises. The VIX measures “expected near-term volatility”, which is quite a bit different than fear of long-term economic concerns.
Key Question: Can stocks go up when the Volatility Index rises significantly from low levels? You can decide for yourself after reviewing a historical example.
Sounding The Low VIX Sirens For Stocks
The VIX Isn’t A Very Good Directional Indicator
If you follow the markets regularly, you have probably run across similar passages to the one shown below from a May 28, 2014 MarketWatch article:
As the VIX continues to sink closer to its historic low of 9.39, many commentators are now discussing the VIX as a “complacency index.” As the VIX falls, it signals increasing levels of investor complacency. Because economist Hyman Minsky taught us that periods of high volatility follow periods of low volatility, many investors are beginning to worry that a “Minsky moment” could be lurking around the next corner that would send volatility higher, increase the risk premium for holding stocks and cause prices to sink.
We agree with portions of the quote above, with two exceptions: (1) when the Volatility Index rises from low levels to higher levels, it does not necessarily mean the stocks are in big trouble, especially when viewed from a longer-term perspective, and (2) low VIX readings do not necessarily align with caution-oriented “complacency”.
Retail Sales Align Nicely With The VIX Story
Having worked on Wall Street for over 20 years, we can confidently state evidence is always available that logically aligns with the bearish narrative for risk-related assets; the same can be said for a bullish narrative. The bearish case got a nice dose of weak data on Thursday, September 15. From Bloomberg:
Sales at U.S. retailers dropped more than forecast in August, indicating a pause in recent consumer-spending strength that has carried the economy. Purchases declined 0.3 percent from July, the first drop in five months, after a revised 0.1 percent advance in the previous month, Commerce Department figures showed Thursday in Washington. The median projection of economists surveyed by Bloomberg called for a 0.1 percent decline. Excluding cars, sales unexpectedly fell 0.1 percent.
Low VIX Means Trouble For Stocks, Right?
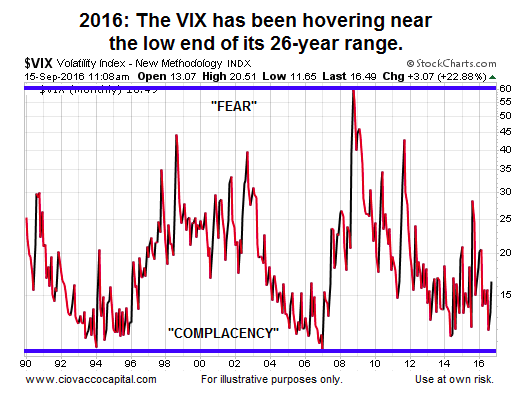
As recently as September 8, 2016, the Volatility Index was hovering near the low end of its long-term range dating back to the 1990s. If that means historic complacency, then logic would tell us that when the VIX rises from very low levels, it must mean rising fear and bad times ahead for stocks…right? That logic often holds in the markets, meaning the VIX can be and is a useful tool for stock investors. However, the strength of a stock market indicator lies in its consistency.
Read more from Chris: Will 2016 Produce An Important Stock Market Top?
Can stocks rise as the Volatility Index rises from low levels? History not only says “yes”, but it does so emphatically. The chart below shows a period beginning in late 1995 when the VIX started to rise from low levels. The VIX surged from 10.36 in 1995 all the way to 38.20 in late 1997, which is a major spike in the Volatility Index.
How did stocks perform over the same period? The S&P 500 gained 47%…yes, that is not a typo…stocks gained 47% during a period when the VIX more than tripled.
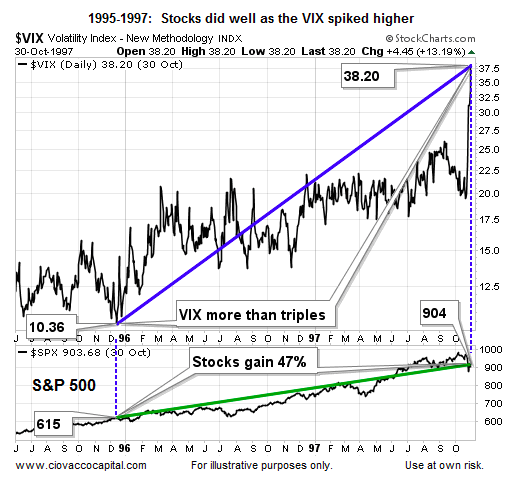
For those scoring at home, the 47% move in stocks began when the VIX showed “a high level of investor complacency” with a reading of 10.36. What was the recent 2016 low in the VIX? 11.02.
continue reading on the next page…


