On Monday the USDA released its September 2016 WASDE report.
The U.S. Corn market highlights were as follows:
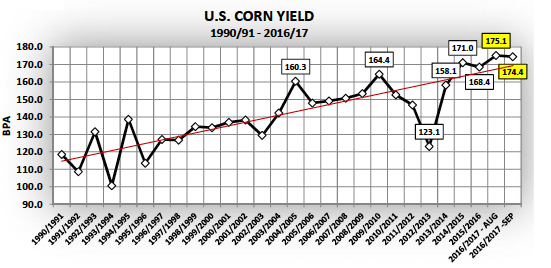
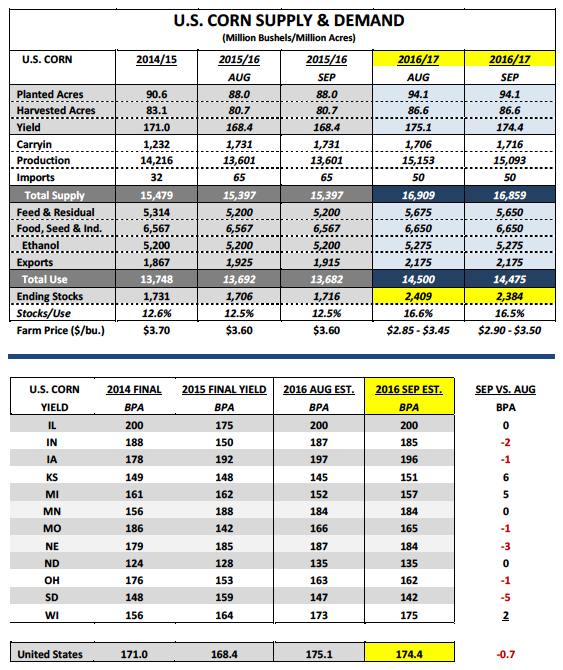
1. The 2016/17 U.S. corn yield was lowered to 174.4 bushels per acre versus 175.1 bpa in August and the average trade guess of 173.4 bpa. The most notable state-by-state yield adjustments were a 2 bpa decrease for Indiana (185 bpa vs. 187 bpa in August), a 1 bpa decrease for Iowa (196 bpa vs. 197 bpa in August), and a 3 bpa decrease for Nebraska (184 bpa vs. 187 bpa in August). Both Illinois and Minnesota’s state corn yields were left unchanged versus August at 200 bpa and 184 bpa respectively. Those 5 states are the largest corn producers in the country accounting for approximately 60% of total U.S. corn production (9,205 million bushels).
2. 2016/17 U.S. corn production was estimated at 15,093 million bushels, down just 60 million bushels versus August. The average trade guess for September was 15,027 million bushels. The USDA’s current production forecast would be a record, exceeding the previous mark from 2014/15 by an incredible 877 million bushels.
3. 2016/17 U.S. corn ending stocks were lowered slightly to 2,384 million bushels versus 2,409 million bushels in August and the average trade guess of 2,329 million. Despite the decrease the U.S. corn carryout is still projected to be up 668 million bushels relative to 2015/16 and nearly 1.1 BILLION bushels above the prior 5-year average.
WHAT WAS THE MARKET REACTION TO THE REPORT?
The immediate reaction was clearly negative. Furthermore the USDA’s supply-side revisions to the 2016/17 U.S. soybean balance sheet only added additional price pressure to the entire Ag complex. The USDA increased the U.S. soybean yield 1.7 bpa to a record 50.6 bpa versus the average trade guess of 49.2 bpa. This resulted in total 206/17 U.S. soybean production increasing to 4,201 million bushels, up 141 million bushels versus August. U.S. soybean ending stocks improved to 365 million bushels, which was 35 million bushels higher than the average trade guess. The collective one-two punch of Bearish U.S. corn and soybean S&D tables resulted in both December 2016 corn futures and November 2016 soybean futures selling off aggressively on Monday and Tuesday. The two day drop in December corn futures totaled 11-cents per bushel with November soybean futures closing down 36-cents per bushel.
Traders will now consider whether or not the USDA will continue to make additional downward adjustments to the U.S. corn yield in the October, November, and January WASDE reports based on the assumption that the high water mark for yield may have already been issued in August at 175.1 bpa (note the USDA does not adjust the yield in the December WASDE report).
That said this week I looked back on previous record to near record corn yield crop years since 2000/01 to determine if there was any discernible trend regarding the timing of when the USDA’s U.S. yield estimates peaked in their monthly WASDE publications. In both 2004/05 and 2009/10 the USDA’s yield forecasts didn’t peak until the January report. However in 2014/15 the highest U.S corn yield estimate came in October at 174.2 bpa versus a November high of 169.3 bpa in 2015/16.
Therefore based on the last two crop years this would seem to suggest that traders should NOT entirely discount the possibility of the USDA still posting a U.S. corn yield forecast above the current August high in either the October or November WASDE reports.
This fact alone should continue to weigh on corn futures prices into the end of September at a minimum. Ultimately actual harvest results will play a much more significant role in deciding what direction the USDA leans on yield going forward.
continue reading on the next page…

: Worrisome to Broader Market?")


