Shares of Twitter (TWTR) broke the $20 level on the downside and declined as low as 19.60 before recovering some of the day’s losses. The move brought TWTR stock to new 52 week lows and continues its recent slide.
Below is an updated stock chart for Twitter (TWTR) as well as a few bullet points based on what I’m seeing across time-frames.
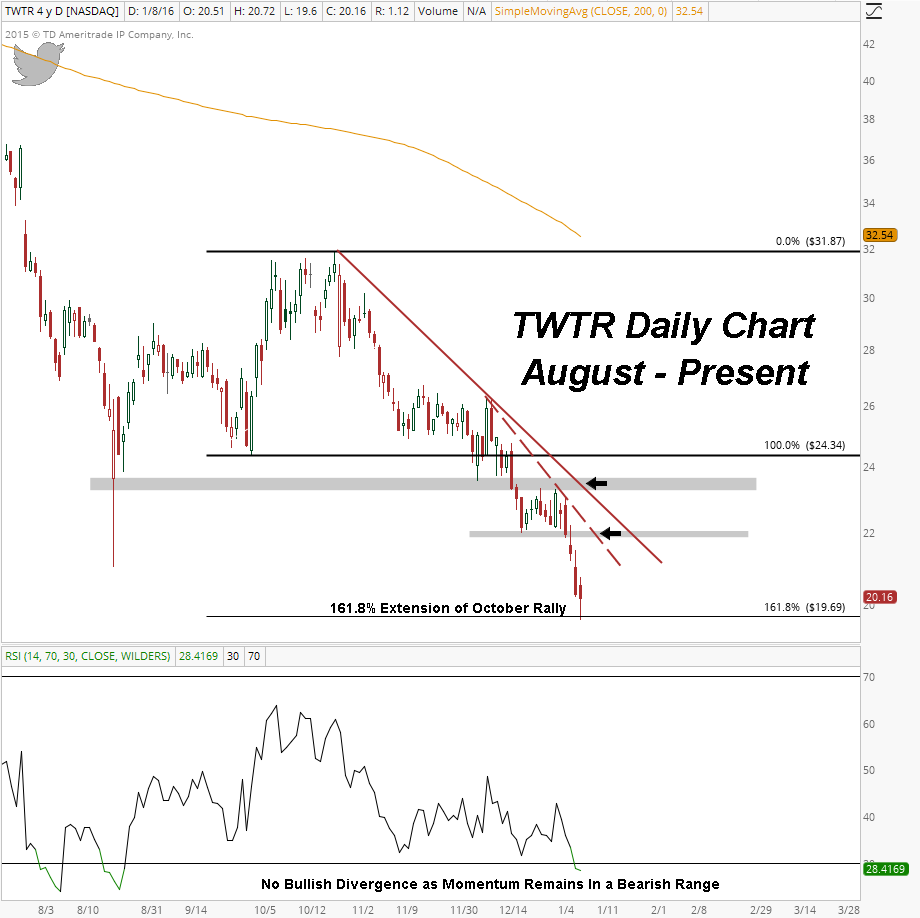
Currently the TWTR stock decline is taking a pause at the 161.8% Fibonacci extension of the October 2015 rally. The stock is oversold but this appears to be short-term. Either way, it may lend a hand to a bounce.
On a macro level, Twitter stock price remains in a downtrend and below the 200 period moving average on all the major time-frames.
The structural target on the weekly chart remains $13.15 based on the 161.8% Fibonacci extension of the April – July 2014 rally (not pictured).
As of now, momentum remains in a bearish range and a lacks any signs of a positive divergence on the weekly, daily, or 65 minute charts.
The stock could bounce in the very short-term, but there is not any evidence to suggest a longer-term bottom is near. Overall the weight of evidence continues to suggest fading strength toward resistance near $22.00 and 23.50, as shown by arrows on the daily TWTR stock chart.
Twitter Stock Chart (TWTR) – Daily Bars
Thanks for reading.
Twitter: @BruniCharting
The author does not have a position in any of mentioned securities at the time of publication. Any opinions expressed herein are solely those of the author, and do not in any way represent the views or opinions of any other person or entity.


