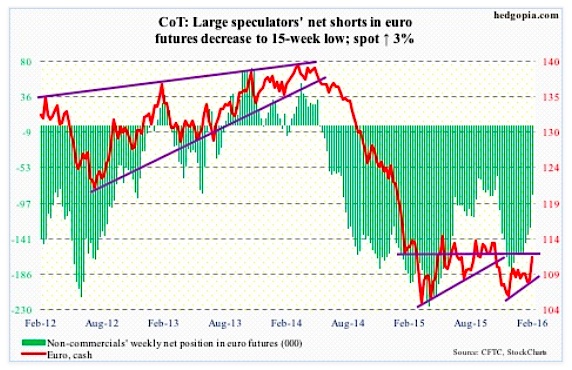
Euro: The Euro surged 1.6 percent on Wednesday, past its 200-day moving average. This was the largest single-session move since December 3rd last year. Back then, the currency rallied 3.1 percent; markets decided that Mario Draghi, ECB president, was not dovish enough, and that he failed to live up to expectations.
On Thursday, Mr. Draghi said that the risk of acting too late on ultra low inflation was greater than that of acting too early as a wait-and-see stance could lead to a lasting loss of confidence. The euro rallied one percent anyway. Markets either decided he was merely jawboning or just traded on technicals. The Thursday rally essentially took care of the one-percent loss last Friday post-Bank of Japan surprise decision to deploy negative interest rates.
By Thursday, the euro was sitting right underneath resistance, which it tried to break out of on Friday, but reversed hard. The daily chart is now in need of unwinding tons of overbought conditions.
Non-commercials’ net shorts are now down to a 15-week low.
February 5 COT Report Data: Currently net short 87.1k, down 40.1k.
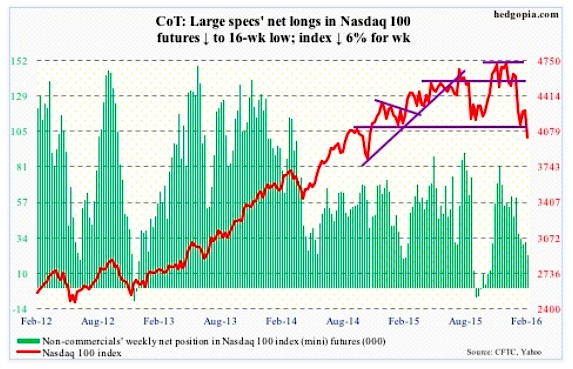
Nasdaq 100 Index (mini): Down six percent for the week, the Nasdaq 100 continues to underperform its major U.S. peers. Here is the problem: It is a market-cap-weighted index.
The top five weights in QQQ, the Nasdaq 100 ETF, are the following stocks: Apple (AAPL), 11.4 percent; Alphabet (GOOGL, formerly Google), 9.2 percent (both A and C); Microsoft (MSFT), 8.5 percent; Amazon (AMZN), 5.8 percent; and Facebook (FB), 4.5 percent.
Last year, the ETF rallied 9.4 percent, better than its U.S. peers. AAPL was a dud, down three percent, but the rest more than made up for this. AMZN surged 117.8 percent, GOOGL 46.6 percent, FB 34.2 percent, and MSFT 22.7 percent.
So far this year, QQQ is down 12.3 percent, with contribution from all top five stocks. AAPL is down 10.2 percent, GOOGL 9.5 percent, MSFT 9.6 percent, AMZN 25.7 percent, and FB 0.6 percent.
And there are signs of exhaustion for tech stocks.
QQQ had red candles in December and January, and so far this month. This followed a monthly doji in November. Similarly, AMZN, which more than doubled last year, had a monthly doji in December, followed by a down January and a down February. Now a laggard, AAPL struggled in the $130 area from February to July last year, before giving way in August. No doubt tech is weighing on the broader stock market.
Similarly, after breaking out of a three-month horizontal resistance at $108 last week, Facebook (FB) on Tuesday produced a long-legged doji right outside the upper Bollinger Band. Also on Tuesday, in a high-volume, post-earnings session, GOOGL produced a shooting star, preceded by a doji on Monday. Not what you want to see out leadership in this heavyweight stock market index.
Non-commercials continue to reduce net long futures positions.
February 5 COT Report Data: Currently net long 21.7k, down 8.5k.
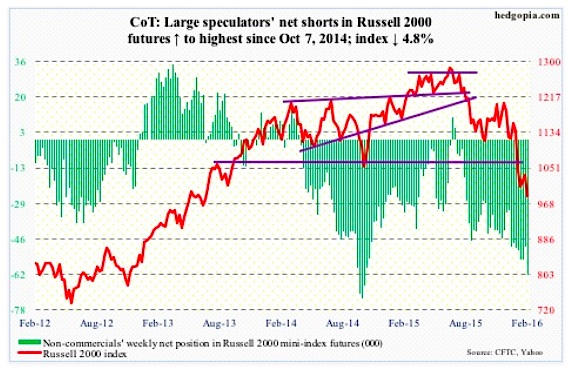
Russell 2000 mini-Index: In the week ended Thursday, $702 million came out of IWM, the iShares Russell 2000 ETF (courtesy of ETF.com).
The small cap stocks index still acts weak. A retest of the January 20th low (958) looks imminent.
February 5 COT Report Data: Currently net short 61.9k, up 13.1k.
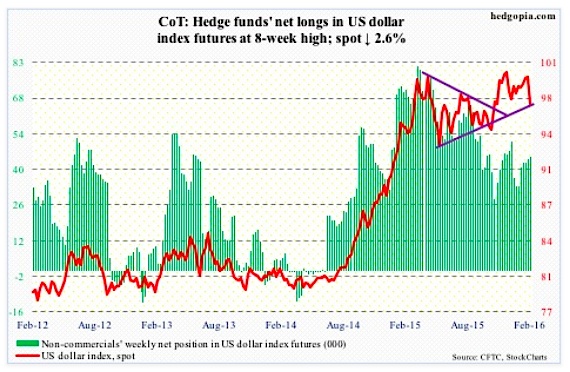
US Dollar Index: The index collapsed 1.6 percent on Wednesday. Was the US Dollar reacting to January’s ISM non-manufacturing PMI, which dropped 2.3 points to 53.5 – the lowest since February 2014? Possibly.
That said, unlike U.S. manufacturing, non-manufacturing is still in expansion. Manufacturing has languished sub-50 the past four months.
Or was it reacting to the 10-year yield that swooned to 1.79 percent intra-day Wednesday before ending up two basis points to 1.88 percent? (Incidentally, with a shooting star on Wednesday, TLT, the iShares 20+ Year Treasury Bond Fund, looks like a short near-term.)
Rate-hike odds are fading… fast. The US Dollar Index had hugged the 50-day moving average for nearly two months. Once the dollar lost that, the reaction has been violent.
The question is, is it a double-top? The 93-plus is yet to be breached. The daily chart of the US Dollar Index is oversold, with encouraging action on Friday. It now faces resistance in the 98 range.
One thing is crystal clear. Non-commercials do not wax enthusiastic over the dollar’s prospects.
February 5 COT Report Data: Currently net long 44.9k, up 647.
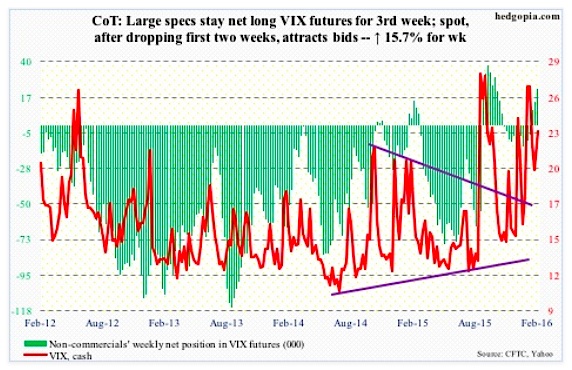
VIX Volatility Index: On Monday, volatility bulls stepped up to support the 50-day moving average, which is now slightly rising. Ditto with the 200-day.
Near-term, there is room to unwind daily oversold conditions. Keep an eye on this measure of market volatility.
February 5 COT Report Data: Currently net long 22.5k, up 8.3k.
Thanks for reading.
Twitter: @hedgopia
Read more from Paban on his blog.
Any opinions expressed herein are solely those of the author, and do not in any way represent the views or opinions of any other person or entity.

: Showing Some Signs of Emerging Strength")
