This past weekend, I spent a couple hours doing some personal finance mentorship. I always find the experience rewarding, as it is a chance for me to help others while tapping into a segment of readership and learning more about their perception and understanding of investments, economics, and personal finance.
One little nugget at the end of our conversation stands out. After talking about household cashflow, the gentlemen I was working with switched gears from personal finance to investment analysis and asked, “what is support and resistance? I see you use the terms in your articles and on technical charts, but I’m not real sure what it means or how you use it.”
As simple as that question was, and as simple as it would have been for me to say, “well those charts are geared toward experienced investors,” I realized that even if that is the case, it is also my passion to be furthering the drive of everyday investors to learn more… and become more experienced! So it is with that idea in mind that I will attempt to do a few more scribes on technical terms and indicators that are a part of my everyday investment conversation.
In its simplest terms, support is a price or pricing area that will either stop or slow a stock or security from going lower. And resistance is a price or pricing area that will either stop or slow a stock or security from going higher. The ability for this area to stop or slow a trend in either direction depends upon the strength/weakness of the given support or resistance area.
And this is where experience comes in handy. Having the confidence and vision to see the area and evaluate just how strong it is, is key — so keep reading and keep analyzing charts! For example, if a stock had just moved from $90 to $100, and the stock had hit in and around $100 five times over the last year but never moved decisively above it, I would say “there is strong resistance at $100.” And on the flip side, if a stock had dropped from $25 to $20 and it had only visited the $20 area once a few months back and held, I might refer to that area as being “initial support,” or an area that “may provide support,” because it doesn’t have a track record of supporting the price at that level.
But there’s so much more. In short, there are four often-used types of support and resistance: moving averages, trend lines, congestion areas, and fibonacci retracements. I’ll attempt to provide some color on each:
1) Moving averages – The most commonly used moving averages are the 20 day, 50 day, 100 day, and 200 day — the longer the duration, the longer term the trend and application. Note that these are averages of the previous closing prices for that certain number of days in the average (here, 20, 50, 100 and 200 days). Moving averages tend to be followed by wall street and active investors and often serve as support (when prices are above them) and resistance (when prices are below them). Even shorter term applications are used for day and swing trading, and longer term when looking at multi-year charts or evaluating cycles.
2) Trend lines – This is the fun part. And it works for short and long term investors. Get out a pen or pencil and a ruler and start drawing lines! Connecting the bottoms will provide you with a supportive trend line, while connecting the tops with give you a resistance trend line. Many times the bottoms or tops are angled with the trend, and sometimes they form “channels.” Tuning into my chartology posts may assist with how and why they are used — observation and experience always helps.
3) Congestion areas – As mentioned earlier, these are pricing areas where a stock has been before and tended to either struggle with or be magnetized to. How often and for how long will define the strength of the support or weakness.
4) Fibonacci retracements – Common fibonacci retracements include .236, .382, .500, .618, .786, and 1.000. These are based off key numbers identified by Leonardo Fibonacci in the 13th century and used by traders to identify retracement from two extreme points (peak and trough). For instance, if a stock falls from 20 to 10 over a couple months, it may encounter resistance upon a corrective retracement move higher at 12.36, 13.82, 15.00, 16.18, 17.86, and 20.00. Fibonacci extensions can also be used for breakouts: 1.272 and 1.618 are popular.
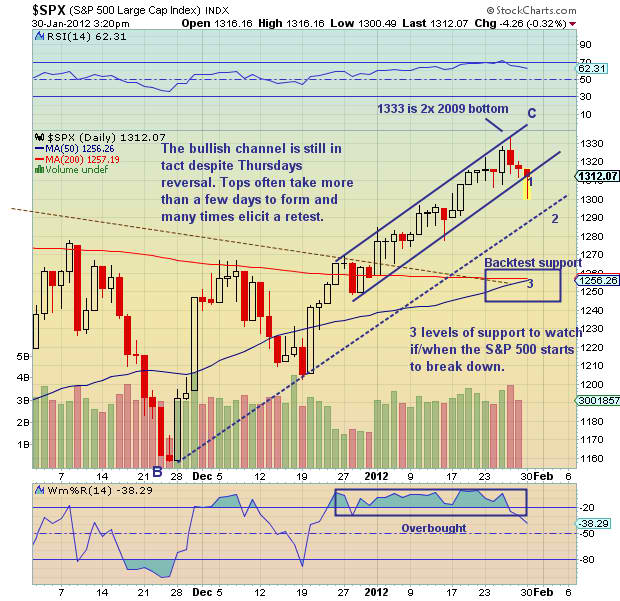
The chart below is of the S&P 500, and provides a graphic example of each of these types as support. For instance trend line support can be found in two distinct areas: one within the near term bull channel (broken briefly today), and the second at intermediate trendline support around 1290. The moving average(s) support level is not in play yet, but can be found in and around 1255 (50 and 200 day moving averages). Note that this area is also the .618 retracement of the 2011 high (1371) to low (1074)… 1257.
You can also learn more about technical analysis in The Anatomy of a Trader series, and more specifically Part 3 of 5: Vision Quest.
Happy investing.
Note that the chart was added after publication as a graphic example.
———————————————————
Your comments and emails are welcome. Readers can contact me directly at andrew@seeitmarket.com or follow me on Twitter on @andrewnyquist or @seeitmarket. For current news and updates, be sure to “Like” See It Market on Facebook. Thank you.
Position in S&P 500 related short index fund SH.
Any opinions expressed herein are solely those of the author, and do not in any way represent the views or opinions of his employer or any other person or entity.


