The good news is that the timing for this piece couldn’t be better, for when markets start to creep with volatility, emotion, and uncertainty, it is truly an investor’s vision that matters. Some may whine, some may cry, and some may even give up, but none of those feelings will make you money. To be the best, you need to be able to tune out the noise and focus on identifying good entry points in good stocks, regardless of whether the markets are leaping or diving.
Case in point, last week I offered up the following on the importance of the multi-week pennant/flag formation in the S&P 500: “The sheer size and scope of this formation is sending a message to market participants that the next move should be both sizeable and volatile.” Although the market had run 15-20% off the lows and sentiment was much better, I knew that there was still too much at risk to be in the market. So I traded a bit and remained mostly in cash. My risk/reward analysis was easy: A breakdown would save me a significant amount in losses while a breakout would confirm the bullish trend and I could get back into the market, missing out on only a small portion of the upside move. Well, as many have seen and felt, the market broke down, and this analysis saved me a good 5 percent or more in losses.
You see, when it comes to investing, I’m not a warm and fuzzy guy. I don’t care about the last earnings report nor how many buy recommendations a stock has. All I care about is time and price: where the stock [or ETF] has been, at what prices, and where it is going. Enter the tools of technical analysis.
Simply put, I rely on technical analysis to raise the probabilities of making money, while limiting downside risk. I’ve always said, give me a good stock, some volatility, and a crayon, and I’ll be livin’ the good life. Now, don’t get me wrong, fundamentals do matter, and especially longer term. But I can’t tell you how many times over the years I have heard folks just simply say, “buy that stock, earnings are great and it’s a winner.” And I think, what, just buy the stock no questions asked, without identifying good entry points and creating an investment plan to average in? Silly. In short, this means that you may have bought a great company like Apple (AAPL) for $395 to $400 (in the example below), no questions asked, even though technical analysis called for lower prices when $400 was violated and couldn’t be retaken. That’s like buying a new computer today for $1,800 even though the store is advertising that it will be on sale Friday for $1,500.
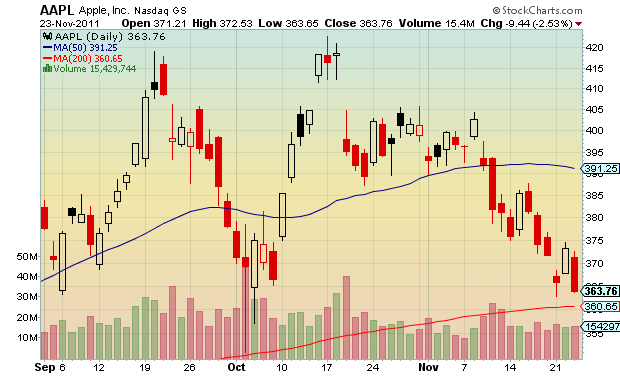
Chart added for short-term, active investing context.
Yet, at the risk of readers thinking that I am dissing fundamentals, let me unequivocally say that fundamentals do matter. Good companies are where good investing is at. In fact, I believe in identifying good companies first, then filtering the ones to target through sound technical analysis. Once I have my list, I develop an investment plan that employs sound risk management, including “limit” buy orders to purchase stocks I like at my prices, and “stop” sell orders to limit losses.
But to get to the planning stage and beyond, we have to see the opportunities first. And with this in mind, here are 10 tools and metrics that will help you become a better technician:
1) Trendlines: Simply connect the dots. The trend is your friend, well, until it’s not. When a trendine breaks down, it’s time to get out and re-evaluate. It will save you money.
2) Watch Volume: When a price moves up or down on high volume, it tends to validate the movement. On the flip side, low volume indicates a lack of conviction.
3) Use Moving Averages: Watch the 50 and 200 Day Moving averages. These averages tend to provide strong support or resistance, similar to trend lines. Use a 20 day moving average as well for short term trading.
4) Keep an eye on Relative Strength and Overbought/Oversold indicators: These metrics will do some of the work for you and most are offered with basic stock charts. I like the RSI (Relative Strength indicator) and the William %R (Overbought/Oversold indicator).
5) Identify support and resistance “congestion” points: Whether long or short term investing, you can use price “channels” or points of congestion to identify support or resistance areas.
6) Learn about technical formations: A few examples include: Bullish — continuation wedges, reverse head and shoulders, double bottoms, cup and handle, ascending triangles, hammer reversals Bearish — head and shoulders, broadening or double tops, wedges, descending triangles, reversals
7) Watch for and understand correlations: For instance, when the dollar goes down, stocks tend to do well (and visa versa). Or when the Volatility Index (VIX) jumps higher, the markets tend to struggle. As well, other correlations can give you an indication of a security’s relative strength (i.e. if the stock market or related sector is down and your stock is up, the stock is exhibiting relative strength).
8) Understand fibonacci retracements: Common fibonacci retracements include .236, .382, .500, .618, .764, and 1.000. These are based off key numbers identified by Leonardo Fibonacci in the 13th century and used by traders to identify retracement from two extreme points (peak and trough). For instance, if a stock moves from 20 to 10, it may encounter resistance upon a corrective retracement at 12.36, 13.82, 15.00, 16.18, 17.64, and 20.00.
9) Learn the basics of DeMark Analysis: Technical investors don’t need to know about every type of analysis, but knowing the basics about a couple is helpful. Tom DeMark, one of the finest market technicians of recent times, developed a form of analysis, DeMark Indicators, to identify probabilities about duration and direction of moves and price targets for such moves. DeMark analysis can be used with short term 10-minute bar charts through long term annual bar charts. TD buy/sell “set-ups” and “signals” are important in understanding market direction. But again, just a basic understanding of DeMark Analysis, coupled with other technical tools and indicators can go a long way.
10) Learn the basics of Elliot Wave Analysis: Robert Prechter is probably the first name that comes to mind. Elliot Wave is another respected form of analysis. The fundamental takeaway of elliot wave analysis is that prices tend to move in 5 waves in the direction of the overarching trend (impulse waves) and in 3 waves contrary to it (corrective waves).
These tools can, and will, make you a better investor. To be the best, you have to be open to learning something new each and every day. A vision quest of sorts. Let your passion guide you and don’t forget to enjoy the journey.
***Find the entire The Anatomy of a Trader series here.
———————————————————
Your comments and emails are welcome. Readers can follow me on Twitter on @andrewnyquist. For current news and updates, be sure to “Like” See It Market on Facebook or sign up for our email.
No positions in any of the securities mentioned at time of publication.
Any opinions expressed herein are solely those of the author, and do not in any way represent the views or opinions of his employer or any other person or entity.


: Showing Some Signs of Emerging Strength")
