Chipotle’s rise and fall over the past year has been hard to watch (and read about). But at the same time, the stock price movements have not been all that unusual.
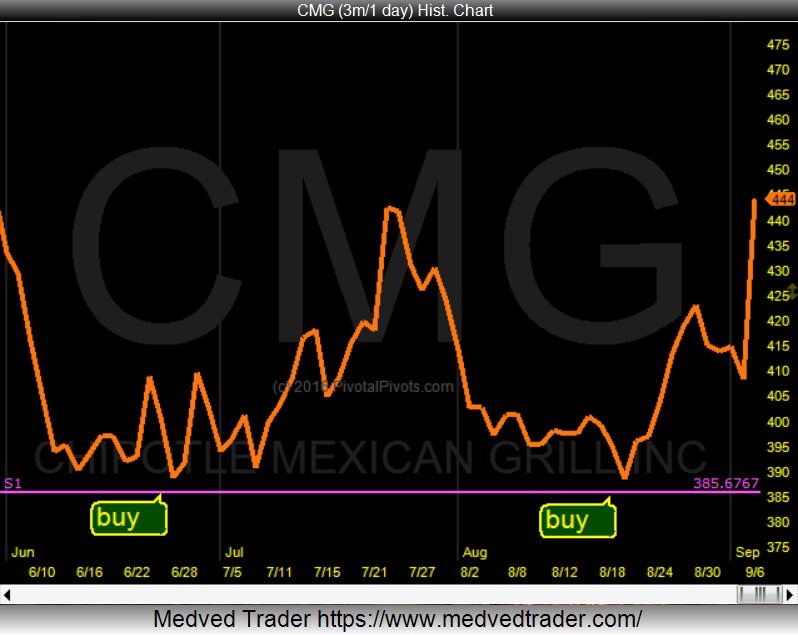
To better understand pivot points and how stocks move, let’s set aside the “news” cycle surrounding Chipotle’s stock price decline. After a final thrust higher, Chipotle (NYSE:CMG) moved from pivot to pivot falling nearly 50 percent over a years time.
And what makes this even more interesting is the stock chart parallels between the rise and fall of Chipotle in 2016 and Apple (NASDAQ:AAPL) in 2013.
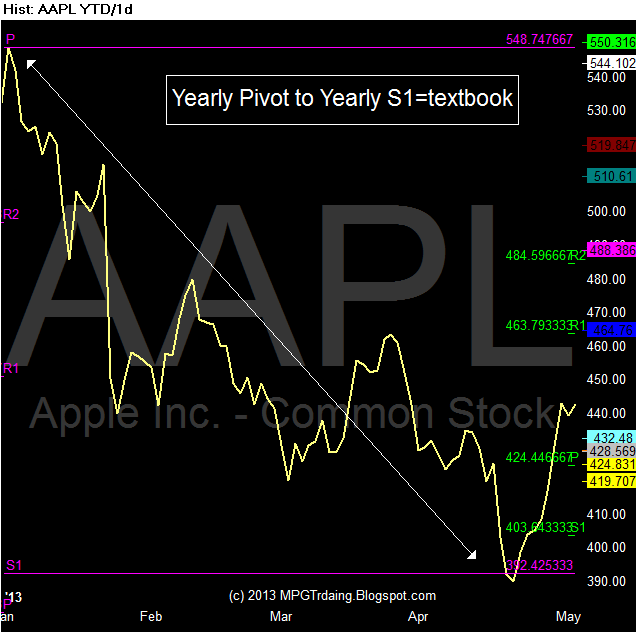
Both stocks hit highs in the $700’s (AAPL was in 2012, CMG in 2015) and then fell to their YearlyS1 pivots in the high $300’s. From there they have bounced.
Here is my 2013 chart of $AAPL:
Here is my 2016 chart of $CMG:
Lesson of this is: The biggest reversals happen on the Yearly Pivot Points. Please check out our new website at PivotalPivots.com.
Thanks for reading.
Twitter: @Pivotal_Pivots
The author is long CMG at the time of publication. Any opinions expressed herein are solely those of the author, and do not in any way represent the views or opinions of any other person or entity.
: Creating Bullish Divergence?")


: Creating Bullish Divergence?")