 Since the February lows, stocks have seen several shallow pullbacks. Most pullbacks have lasted 2 to 4 days, while the lone outlier lasted 7 days. This consistent patterning has shown up in longer spurts during this bull market and is otherwise known as buy the dip (or BTD).
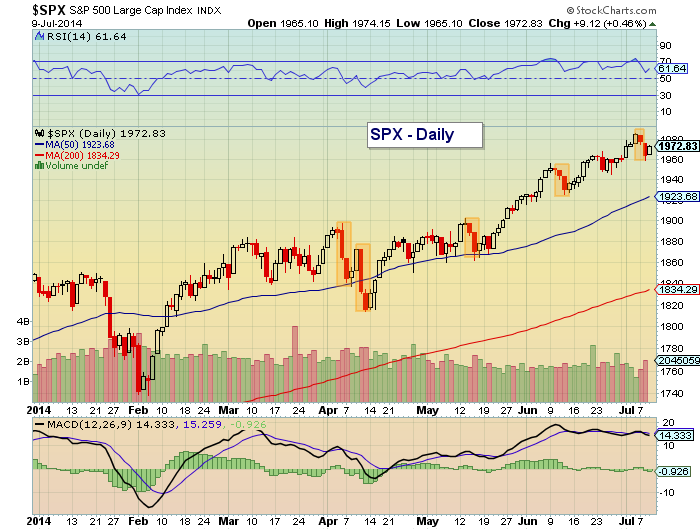
Looking at the chart below, 3 things stand out to me regarding recent pullbacks:
1. Since the April lows, the market has twice seen a back-to-back red candle pattern that looks similar to the Monday/Tuesday candles of this week. If that precedent is playing out again, then BTD may have been in effect today. Note, though, that this would require Tuesday’s lows to hold. 2032 still remains my lone near-term “stretch” price target for the S&P 500.
2. The pullback in April was a bit deeper, but it came out of a sideways grinding formation that looked a bit toppy. It also had a similar type of red candle pattern. But this played out with double vision, as a two day rally gave way to a another double day dip.
3. 1960 is clearly the first support level. Below that comes light support between 1945-1950, followed by the mid-June breakout retest low at 1925.78 (which also coincides with the 50 day moving average).
With the S&P 500 near 2000, it is wise to be on alert for any changes in price behavior. The patterned conditioning of just buy the dip will eventually give way to complacency. And that’s when corrections occur.
No position in any of the mentioned securities at the time of publication. Any opinions expressed herein are solely those of the author, and do not in any way represent the views or opinions of any other person or entity.


