720 Global has repeatedly warned that U.S. equity valuations are historically high and, of equal concern, not properly reflective of the nation’s weak economic growth potential. In this article we provide further support for that opinion by examining the ratio of equity prices to corporate revenue also known as the S&P 500 Price to Sales Ratio (P/S).
At its current record level, the S&P 500 price to sales ratio leads us to one of two conclusions: 1) Investors are extremely optimistic about future economic and earnings growth or 2) Investors are once again caught up in the frenzy of an equity bubble and willing to invest at equity valuations well above the norm.
Either way, the sustainability or extension of the current P/S ratio to even higher levels would be remarkable. What follows here is an exercise in logic aimed at providing clarity on the topic.
Before showing you the current S&P 500 price to sales ratio (P/S) in relation to prior market environments, it is important to first consider two related concepts that frame the message the stock market (S&P 500 – INDEXSP:.INX) is sending us.
Concept #1 – Investors should accept higher than normal equity valuation premiums when potential revenue growth is higher than normal and require lower than average premiums when potential revenue growth is lower than normal.
Consider someone who is evaluating the purchase of one of two dry cleaning stores (A and B). The two businesses are alike with similar sales, pricing, and locations. However, based on the buyers’ analysis, store A’s future revenue is limited to its historical 2% growth rate. Conversely, the potential buyer believes that store B, despite 2% growth in the past, has a few advantages that are underutilized which the buyer believes can potentially produce a revenue growth rate of 10%. If stores A and B are offered at the same price the buyer would most likely opt to purchase store B. It is also probable the buyer would be willing to pay a higher price for store B versus store A. Therefore highlighting that revenue growth potential is a key factor when deciding how much to pay for a business.
Purchasing a mutual fund, ETF or an equity security is essentially buying a claim on a potential future stream of earnings cash flows, just like the dry cleaning business from the prior example. The odds, therefore, of a rewarding investment are substantially increased when a company, or index for that matter, offering substantial market growth potential is purchased at a lower than average P/S ratio. Value investors actively seek such situations in the stock market.
Logically one would correctly deduce that P/S ratios should tend to follow a similar directional path as expected revenues.
Concept #2 – Corporate earnings growth = economic growth
Corporate earnings growth rates and economic growth rates are nearly identical over long periods. While many investors may argue that corporate earnings growth varies from the level of domestic economic activity due to the globalization of the economy, productivity enhancements that lower expenses for corporations, interest rates and a host of other factors, history proves otherwise.
Since 1947, real GDP grew at an annualized rate of 6.43%. Over the same period, corporate earnings grew at a nearly identical annualized rate of 6.46%. Thus, expectations for future corporate earnings over the longer term should be on par with expected economic growth although short term differences can arise.
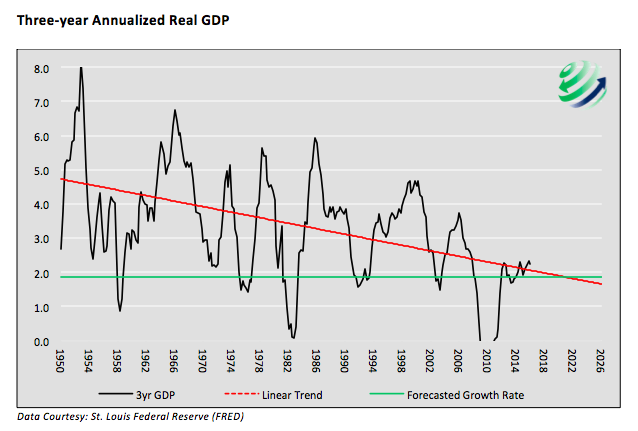
The graph below shows the running three-year annualized growth rate of U.S. real GDP since 1950. While there have been significant ebbs and flows in the rate of growth over time, the trend as shown by the red dotted regression line is lower. The trend line forecasts average GDP growth for the next 10 years (green line) of 1.85%, a level that is historically recessionary.
As we have shared before, the combination of negligible productivity growth, heavy debt loads, short-termism and demographic changes will continue to produce headwinds that extract a heavy price on economic growth in the years ahead. Barring major changes in the way the economy is being managed or a globally transformative breakthrough, there is little reason to expect a more optimistic outcome. Given this expectation, the outlook for corporate earnings is equally dismal and likely to produce similar negligible growth rates.
Reality
The graphs below chart the S&P 500 (blue line/top graph) and the median S&P 500 P/S ratio (red line/ bottom graph) since 1964. As shown in the bottom graph, the P/S ratio is now 2.50 standard deviations from the median and well above the prior levels preceding the significant bear markets of 2000-2002 and 2007-2009.

Based on the fact that the S&P 500 price to sales ratio has been steadily rising and has eclipsed prior peaks, we are left to select from one of two conclusions as we mentioned previously:
- that investors are extremely optimistic about the potential for revenue growth, or
- investors are once again caught in the grasp of bubble mentality and willing to pay huge premiums to avoid missing out on further gains.
After further deliberation, however, there is a very plausible third possibility. Perhaps the lack of viable options for investors to generate acceptable returns, has them reluctantly ignoring the risks they must assume in those efforts. If that is indeed the case, then one should also consider the possibility that the next correction will extract more than a pound of flesh in damage.
We remain confident that extravagant earnings and economic growth are not in the cards, and it is very likely monetary policy is fueling a new form of bubble logic. Invest with caution!
Thanks for reading.
Twitter: @michaellebowitz
Any opinions expressed herein are solely those of the author, and do not in any way represent the views or opinions of any other person or entity.
 Rolling Over At Key Fibonacci Level?")


