Stock Market Outlook for October 19, 2016 –
The bounce that began early this morning continues on S&P 500 futures trading. However, price resistance is still lodged at 2141-2144 and a band of congested sellers sits near 2136 and 2138.5. Price support has shifted up to 2126.5. Market momentum on the S&P 500 (INDEXSP:.INX) is slowly lifting as charts rise into resistance.
See today’s economic calendar with a rundown of releases.
TODAY’S RANGE OF MOTION
S&P 500 Futures Trading Chart – October 19
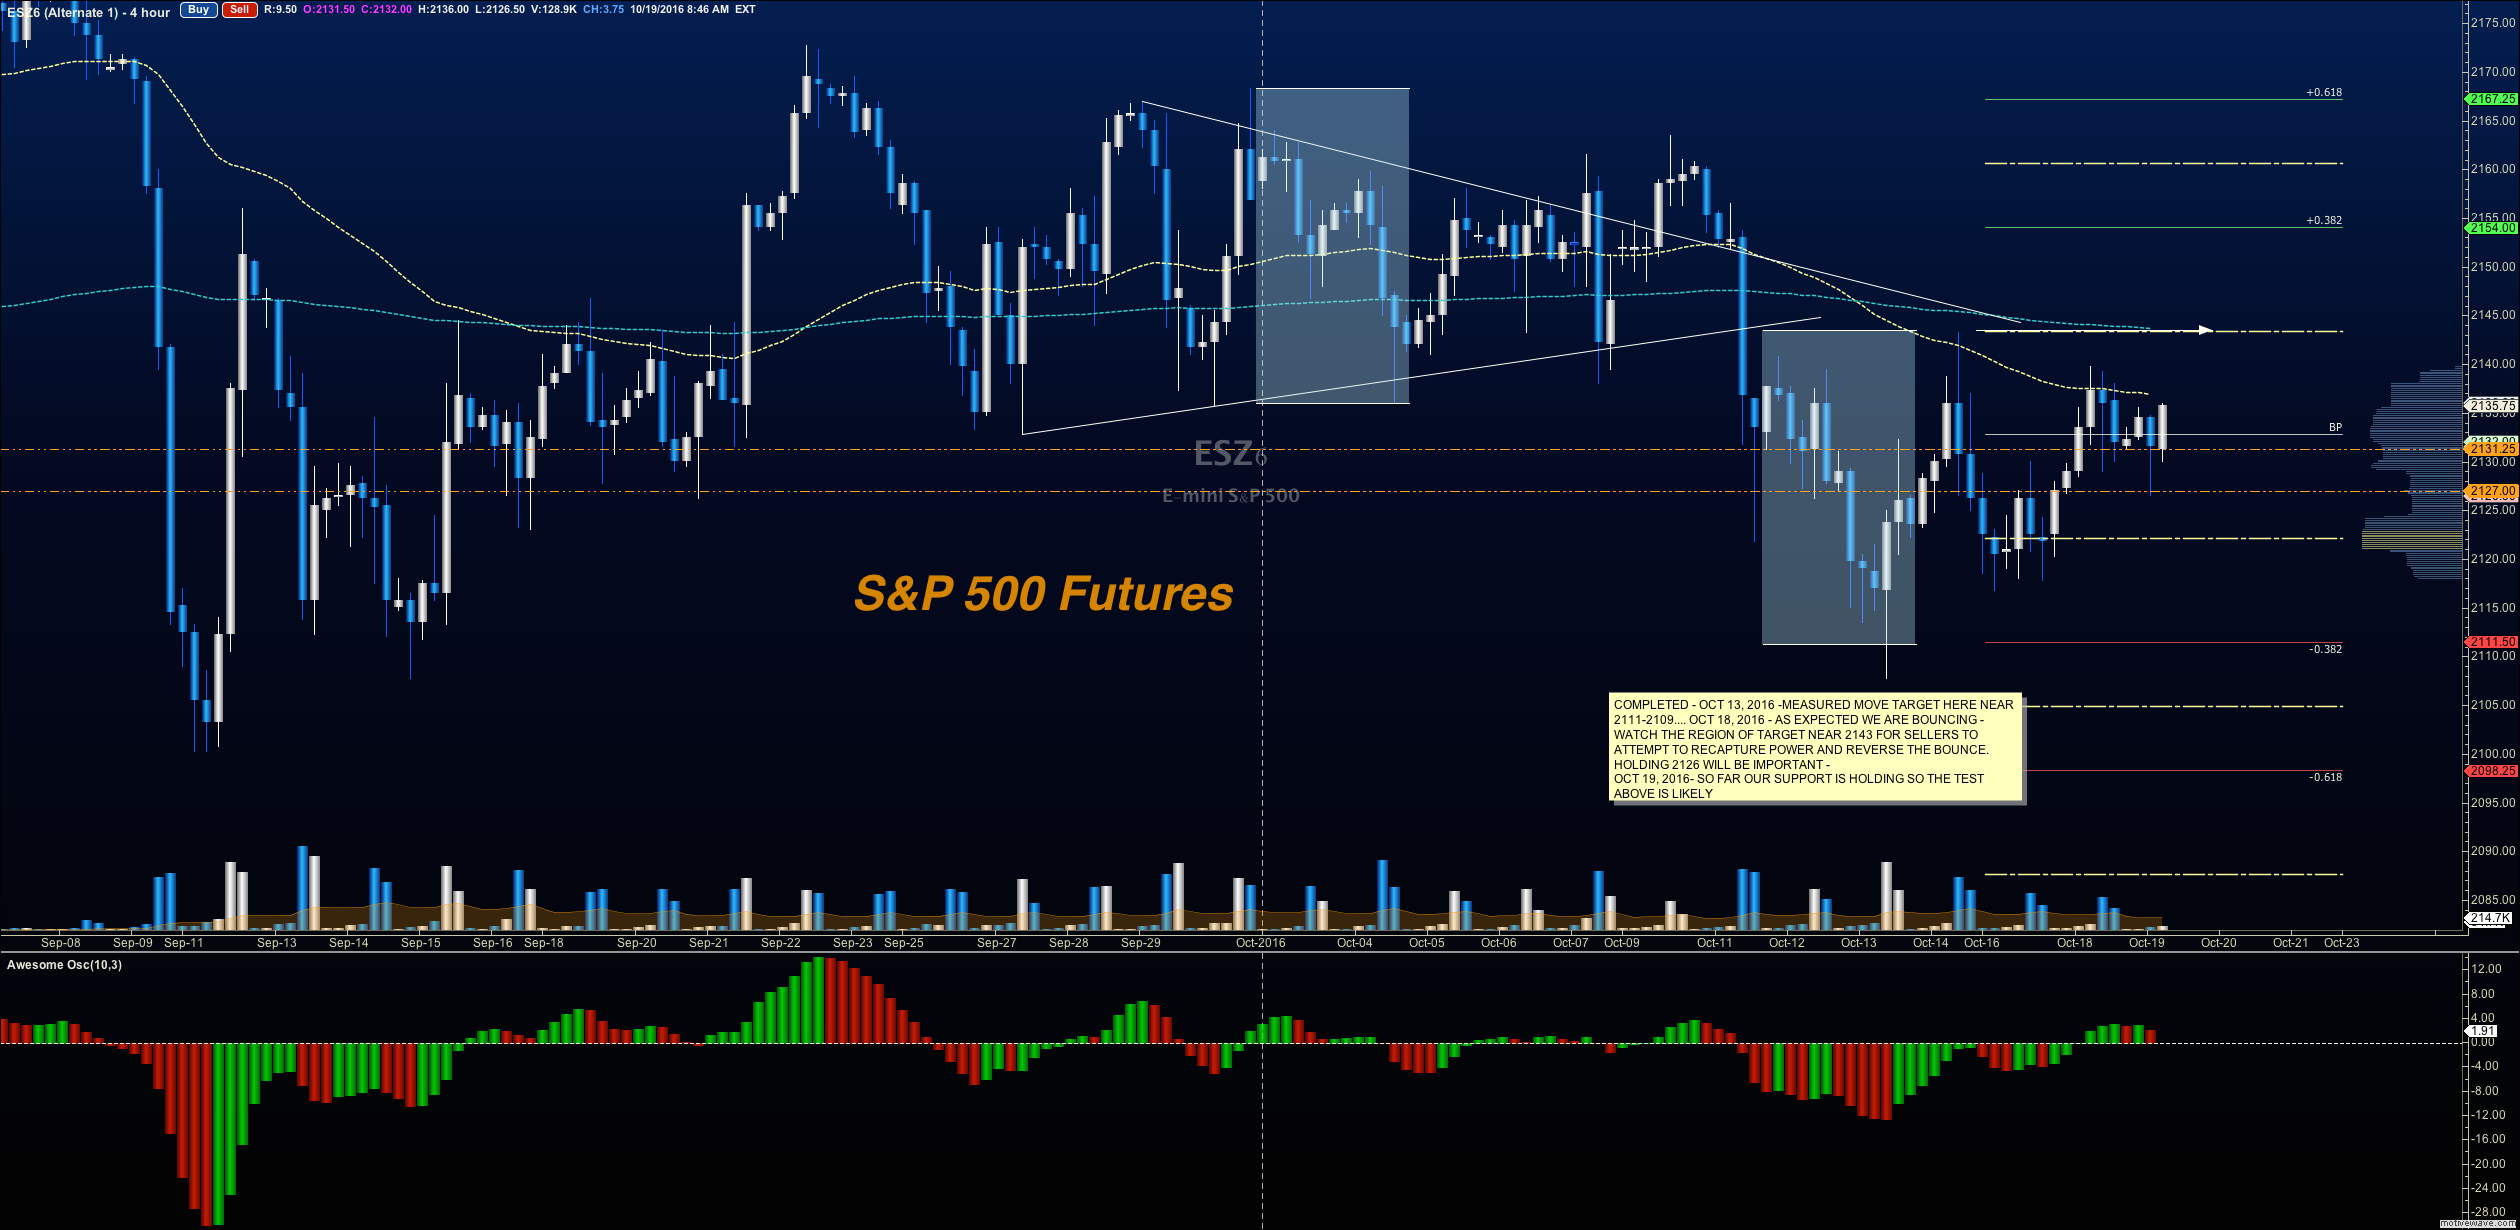
Upside trades in S&P 500 futures trading – Favorable setups sit on the positive retest of 2138.5, or a positive retest of the bounce off 2126.5 with upward momentum. I use the 30min to 1hr chart for the breach and retest mechanic. Targets from 2126.5 are 2128.5, 2130.5, 2134.25, 2136, 2138, 2140.50, and 2144 to 2151. As always, additional targets will be in the Members only portion of the morning blog.
Downside trades – Favorable setups sit below the failed retest of 2126, or at the failed retest of 2130 (watch for the higher low if this is attempted) with negative divergence. Retracements into lower levels from 2130 give us the targets of 2126.5, 2123.75, 2121.5, 2119, 2116.75, 2112.75, and 2109.5 Additional targets will be in the Members only portion of the morning blog, and in the live trading room.
Nasdaq Futures
The NQ_F faded off its high markedly from yesterday and bounced off 4811. This will be lower support today. Congestion regions between 4814 and 4818 will give us a wide bounce area for bullish activity. Higher resistance sits near 4841 with 4851 above.
Upside trades in Nasdaq futures trading – Favorable setups sit on the positive retest of 4833.5, or a positive retest of 4815.5 with positive momentum. I use the 30min to 1hr chart for the breach and retest mechanic. Targets from 4815.5 are 4823.25, 4827.75, 4832.75, 4836.75, 4842.5, and 4848.5. Above there, and we could see 4851-4861. As always, additional targets will be in the Members only portion of the morning blog, and in the live trading room.
Downside trades – Favorable setups sit below the failed retest of 4811.75 (needs negative momentum here for continuation), or at the failed retest of 4833 with negative divergence. Retracements into lower levels from 4833 are 4828.5, 4825.75, 4815.75, 4812.25, 4806.75, 4803.5, 4797.75, 4794.5, 4787.5, 4784.75, and 4781 to 4774. See the blog for additional targets.
Crude Oil
EIA report comes out today and oil has done a great job of holding the bounce after the API report yesterday afternoon. The levels between 50.46 and 50.6 will likely hold as support. Higher resistance levels will begin around 51.6, with 52.42 above. Price action holds a breakout formation, though it is jammed up against resistance levels.
Trading ranges on crude oil futures should still hold between 50.3 and 52.42 in the current pattern.
Upside trades on crude oil can be staged on the positive retest of 51.45, or at a positive retest off 50.76 with positive momentum. Beautiful gap roll bounce that I suggested yesterday held. I often use the 30min to 1hr chart for the breach and retest mechanic. Targets from 50.76 are 50.89, 51.06, 51.29, 51.43, 51.61, 51.84, 52.02, and 52.24 to 52.42. See the blog for more details on the chart action.
Downside trades can be staged on the failed retest of 50.7 (watch for higher lows with this test), or at the failed retest of 51.61 with negative divergence. If the price tests above 51.17 in the current space we are likely to breach into higher highs, so use caution shorting at the breach of congestion. Targets from 51.61 are 51.45, 51.32, 51.15, 50.92, 50.71, 50.62, 50.38, 50.24, 49.94, 49.80, 49.68, and 49.47. Additional targets will be in the Members only portion of the morning blog, and in the live trading room.
Visit TheTradingBook.com for more insights & stock market futures analysis.
If you’re interested in the live trading room, it is now primarily stock market futures content, though we do track heavily traded stocks and their likely daily trajectories as well – we begin at 9am with a morning report and likely chart movements along with trade setups for the day.
As long as the trader keeps himself aware of support and resistance levels, risk can be very adequately managed to play in either direction as bottom picking remains a behavior pattern that is developing with value buyers and speculative traders.
Twitter: @AnneMarieTrades
The author trades stock market futures every day and may have a position in mentioned securities at the time of publication. Any opinions expressed herein are solely those of the author, and do not in any way represent the views or opinions of any other person or entity.


 Ready To Break Out?")

