Stock Market Outlook for October 18, 2016 –
The bounce that began yesterday afternoon on the S&P 500 (INDEXSP:.INX) is continuing this morning. Price resistance on S&P 500 futures is lodged at 2141-2144; but before that, a band of congested sellers waits near 2136 and 2138.5. Price support has shifted up to 2116.5. The next couple of days will be critical, and it should be choppy into resistance. Market momentum is lifting as charts rise into resistance.
See today’s economic calendar with a rundown of releases.
TODAY’S RANGE OF MOTION
S&P 500 Futures Trading Chart – October 18
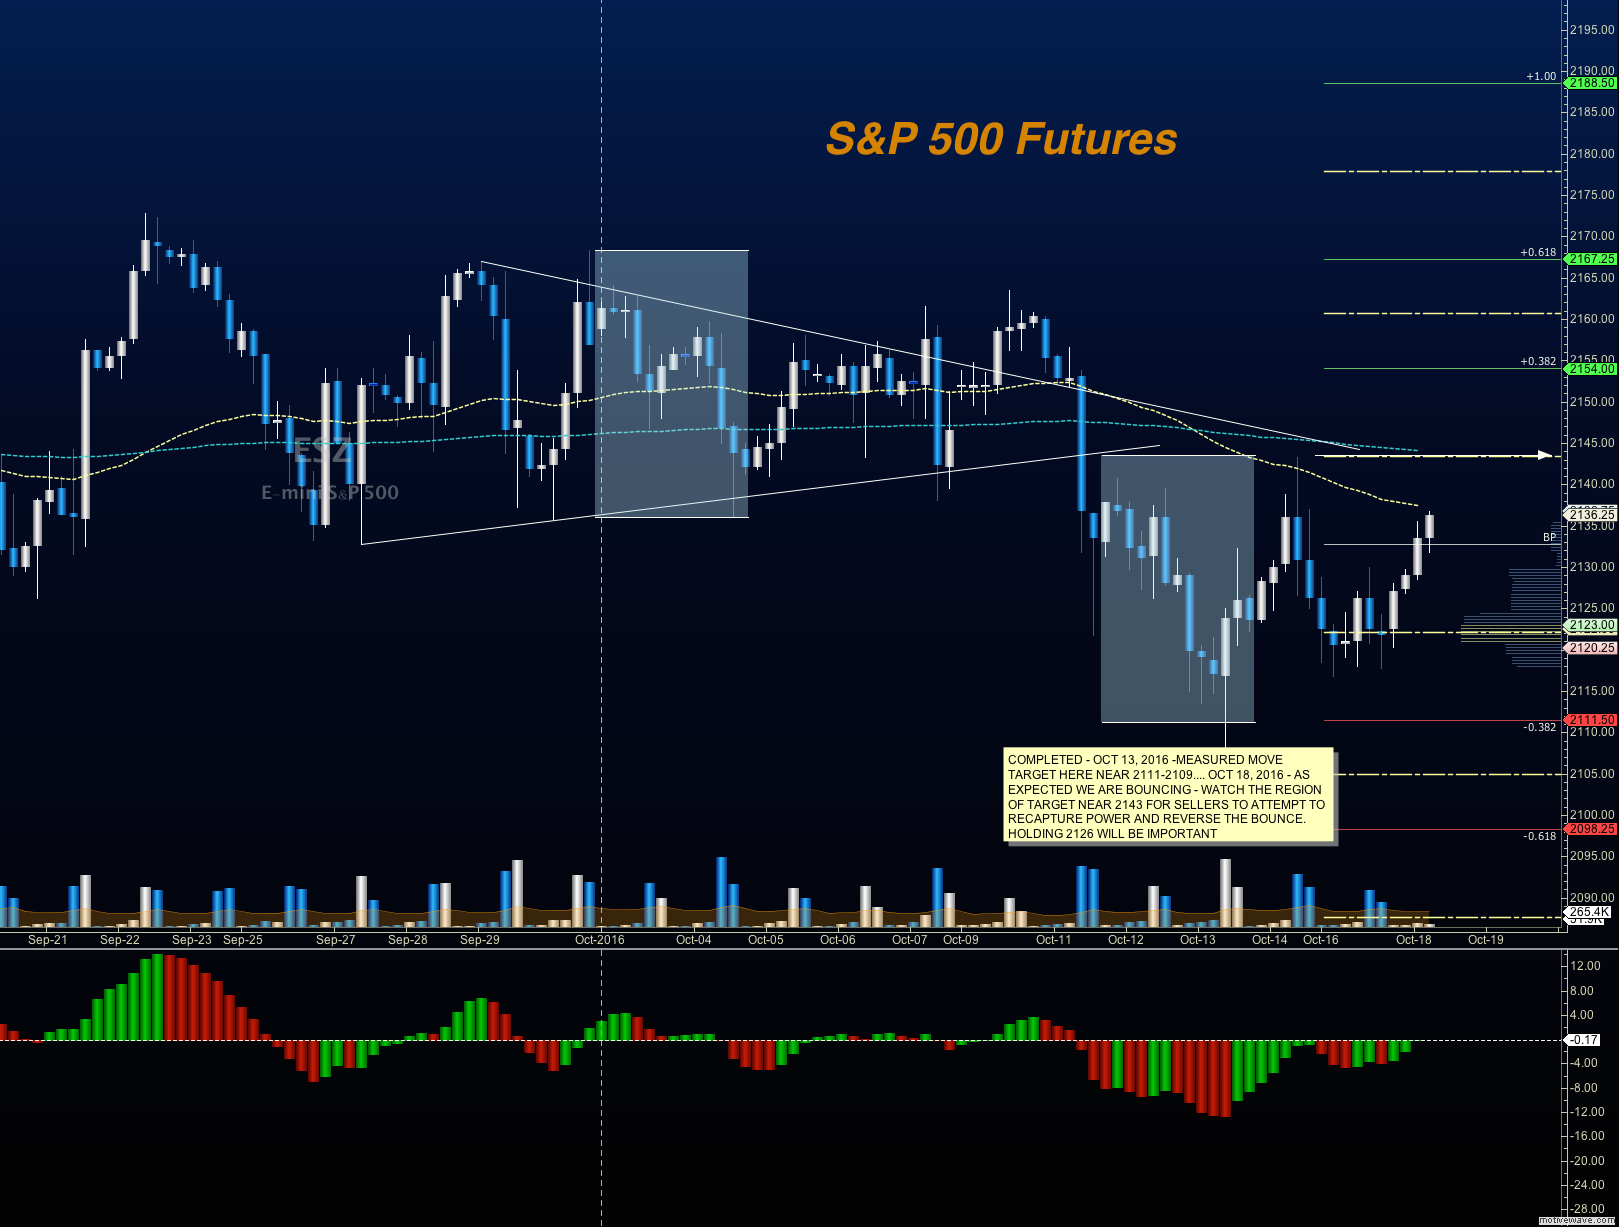
Upside trades on S&P 500 futures – Favorable setups sit on the positive retest of 2138.5, or a positive retest of the bounce off 2126.5 with upward momentum. I use the 30min to 1hr chart for the breach and retest mechanic. Targets from 2126.5 are 2128.5, 2130.5, 2134.25, 2136, 2138, 2140.50, and 2144 to 2151.
Downside trades on S&P 500 futures – Favorable setups sit below the failed retest of 2126, or at the failed retest of 2142 (watch for the higher low if this is attempted) with negative divergence. Retracements into lower levels from 2142 give us the targets of 2140.5, 2136.25, 2129.25, 2126.5, 2123.75, 2121.5, 2119, 2116.75, 2112.75, and 2109.5.
Nasdaq Futures
The NQ_F also held its bounce from yesterday, and in the overnight has come into the base of higher resistance at 4837.5. Congestion regions will now be the region of 1st support, between 4814 and 4818. Higher resistance sits near 4841.
Upside trades on Nasdaq futures – Favorable setups sit on the positive retest of 4802.25, or a positive retest of 4822 with positive momentum. I use the 30min to 1hr chart for the breach and retest mechanic. Targets from 4822 are 4825.75, 4832, 4836.75, 4841.5, and 4843. Above there, and we could see 4861.
Downside trades on Nasdaq futures – Favorable setups sit below the failed retest of 4825.25 (needs negative momentum here for continuation), or at the failed retest of 4840.5 with negative divergence. Retracements into lower levels from 4840.5 are 4837.5, 4832.5, 4828, 4825.75, 4815.75, 4808, 4806, 4803.5, 4796, 4794.5, 4790.5, 4784.75, and 4781 to 4774.
Crude Oil
The levels between 50.46 and 50.6 are being tested again, and trying to hold as support. We have rolled to the Nov contract (though TOS may say Dec). Higher resistance levels loom near 50.9 and 51.17. Price action remains orderly into the API number after the close today. Support today holds near 49.84 to 49.46.
Trading ranges on crude oil should still hold between 49.4 and 51.7 in the current pattern.
Upside trades on crude oil can be staged on the positive retest of 50.9, or at a positive retest off 50.42 with positive momentum. The roll of the contract has created a gap, so we can anticipate a fade into that region – a lower bounce event may occur near 50.12. I often use the 30min to 1hr chart for the breach and retest mechanic. Targets from 50.42 are 50.59, 50.77, 50.89, 51.06, 51.29, 51.43, and 51.49.
Downside trades on crude oil can be staged on the failed retest of 50.38 (watch for higher lows with this test), or at the failed retest of 51.1 with negative divergence. If the price tests above 51.17 in the current space we are likely to breach into higher highs, so use caution shorting at the breach of congestion. Targets from 51.1 are 50.87, 50.71, 50.62, 50.38, 50.24, 49.94, 49.80, 49.68, and 49.47.
Visit TheTradingBook.com for more insights & stock market futures analysis.
If you’re interested in the live trading room, it is now primarily stock market futures content, though we do track heavily traded stocks and their likely daily trajectories as well – we begin at 9am with a morning report and likely chart movements along with trade setups for the day.
As long as the trader keeps himself aware of support and resistance levels, risk can be very adequately managed to play in either direction as bottom picking remains a behavior pattern that is developing with value buyers and speculative traders.
Twitter: @AnneMarieTrades
The author trades stock market futures every day and may have a position in mentioned securities at the time of publication. Any opinions expressed herein are solely those of the author, and do not in any way represent the views or opinions of any other person or entity.


 Ready To Break Out?")
