It was a rough week for stocks. The S&P 500 suffered its second worst week of the year and just about every asset class was hit hard.
Most investors are asking, what’s going on here?
Well, it would be easy to chalk the sharp pullback up to overbought conditions and climbing “too far too fast”. And although that’s definitely part of it, I believe that there is more to it.
Looking at the chart below, you can see how the S&P 500 broke down below its rising channel during the August stock market correction. Also note that the August correction occurred from a very important technical resistance area: the 161.8 Fibonacci extension level (2140ish).
After the August decline, stocks began to find their footing and a big October rally took place. See my post on the bottoming formation written on October 8th: “Double Bottom Could Have Big Implications“.
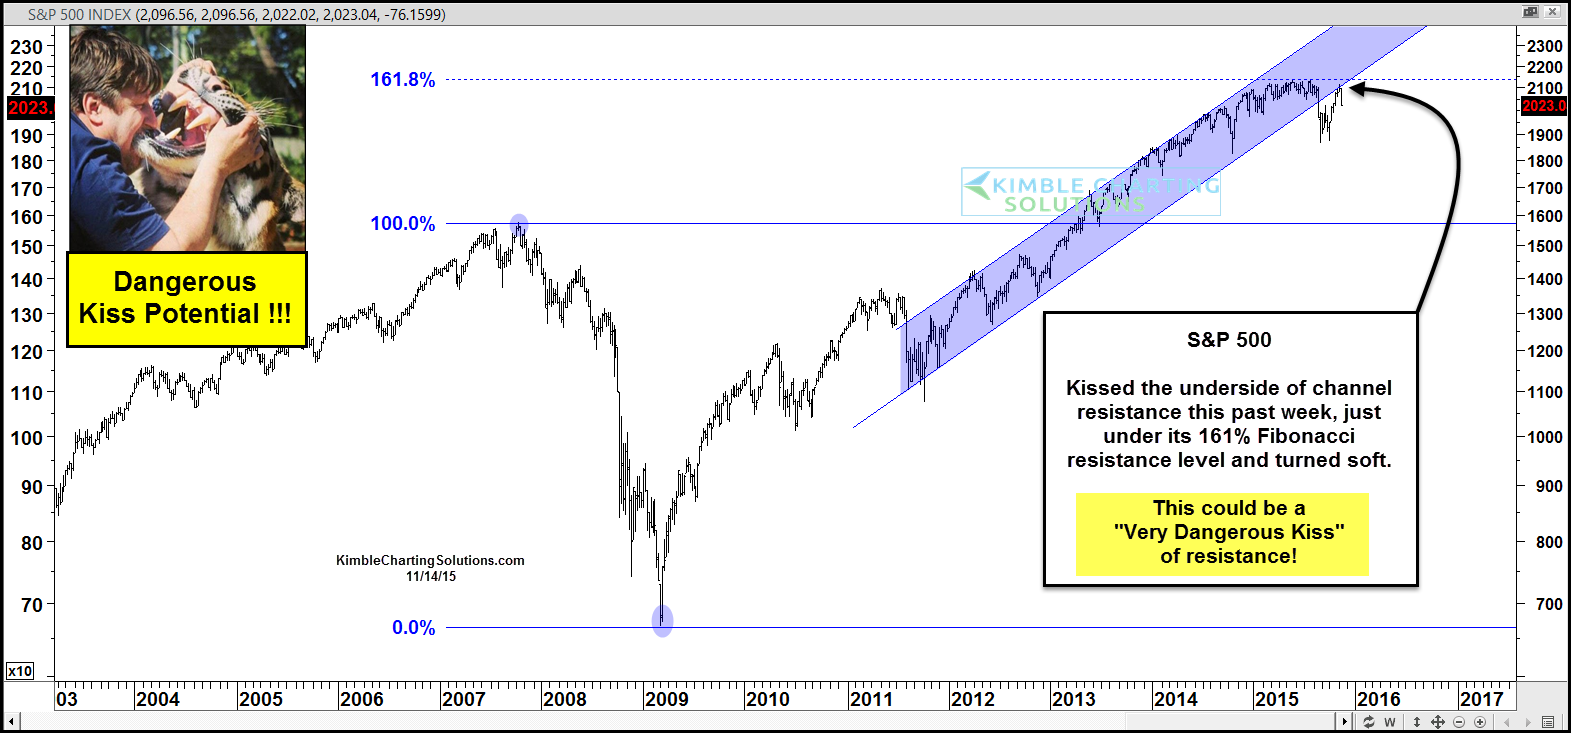
The recent rally, though, pushed stocks back up near important technical resistance at the 2100 level last week. In fact, the rally brought the S&P 500 back up to kiss the underside of the broken uptrend channel (see chart below).
That could wind up being one dangerous kiss!
The market confirmed this resistance by pulling back almost 4 percent this week.
S&P 500 Chart – A Dangerous kiss?
How the market behaves over the coming days/weeks will be important to watch. This will decide if we are seeing an orderly pullback, or a dangerous move lower. Thanks for reading.
Twitter: @KimbleCharting
Any opinions expressed herein are solely those of the author, and do not in any way represent the views or opinions of any other person or entity.

: Showing Some Signs of Emerging Strength")
