If there’s one bullish formation that investors like to see it’s a double bottom pattern. Could this be occurring on one of the major U.S. stock market indices? Well, if this potential turns into reality it would be very bullish for stocks.
U.S. heavyweight, the S&P 500 Index, recorded a low of 1867.01 on August 24th and a low of 1871.91 on September 29th. And since the second low (a retest), the S&P 500 has rallied all the way back up over 2000.
The potential S&P 500 double bottom comes just above the 4-5 year rising channel support, which makes it all the more important!
So what should we watch for over the near-term?
Should the index push above the initial rally highs at 2020 (middle of the “W”), the double bottom could have legs (perhaps en route to a retest of the highs), But one sticky area will need to be overcome as further confirmation: 2040-2050. That price band is a overhead resistance made up of prior supports (now resistance).
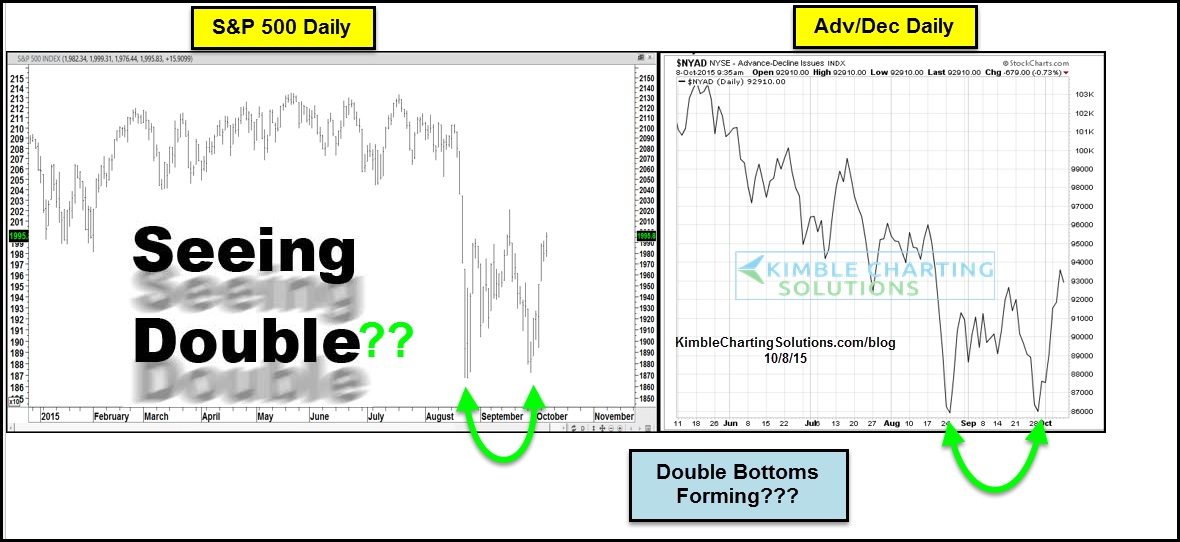
Lastly, the potential double bottoms on the S&P 500 comes at a time when we are seeing a similar double bottom formation in the NYSE Advance-Decline Line (a good barometer of market breadth).
S&P 500 Daily and NYSE Advance-Decline Line – Double Bottoms?
This potential double bottom formation could have major implications for stocks. A breakdown below the existing double bottom lows would bring lots of risk and volatility, while continuation higher may signal an end to the downturn. The coming days ahead will be important to stay tuned!
Thanks for reading.
Twitter: @KimbleCharting
Any opinions expressed herein are solely those of the author, and do not in any way represent the views or opinions of any other person or entity.


