U.S. corporate bond issuance is on track for yet another record year this year.
In the first half, corporate bond issuance totaled $877.7 billion, comprised of $697.8 billion in investment-grade and $179.9 billion in high-yield. Annualized, both categories, as well as the total, are on track for a record 2015 (Chart 1).
If the first-half pace sustains in the second half, we are looking at corporate bond issuance of $1.76 trillion! This will be the 6th consecutive year of one-trillion-plus issuance. Notice the spike in the yellow bar in Chart 1 below. But will corporate bond issuance really end up being that high this year?
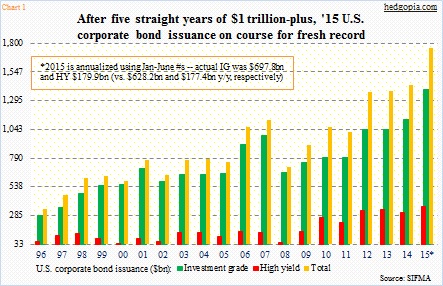
In 2014, investment-grade bond issuance in the first half was $628.2 billion, and $177.4 billion in high-yield. This is comparable to what we have seen so far this year. However, the pace softened in the second half last year, slowing to $497.1 billion and $134.3 billion, respectively; as percent of total issuance, 1H made up 56.1 percent. If 2H this year mimics 2014, then total issuance will come in around $1.56 trillion, not $1.76 trillion. However, this will still exceed last year’s $1.43 trillion.
The rush to issue debt is understandable. Several factors are in play.
1. With FOMC members actively talking about their willingness to normalize rates, corporate treasurers – rightly or wrongly – are probably beginning to think the window might be closing.
2. Thanks to the Fed and its zero interest-rate policy, rates are historically low. Ten-year Treasuries closed today yielding 2.28 percent. This not only gives corporations an incentive to lock in low rates but also forces investors to go up the risk curve and look for higher yields. Hence the high demand for corporate bonds. In each of the past three years, high-yield issuance has been north of $300 billion; this year is on track as well.
3. Post-Great Recession, U.S. real GDP has grown at a seasonally adjusted annual rate of 2.2 percent. This is substantially below average. The average since 1947 is 3.3 percent. Accordingly, businesses are struggling to grow the top line. In the first quarter, sales for S&P 500 companies fell 2.4 percent; if consensus estimates are right, they will have dropped another 3.5 percent in the second quarter. Enter financial engineering – in the form of share buybacks and dividend increases. We can also throw in mergers and acquisitions to the mix. Corporations need money to do all this. The bond market has more than helped.
The negative aspects in all this are that capital expenditures remain suppressed. This can adversely impact productivity, even as leverage has gone up. From this perspective, for whatever it is worth, corporations are being myopic, and this in due course will come back to bite them on the derriere.
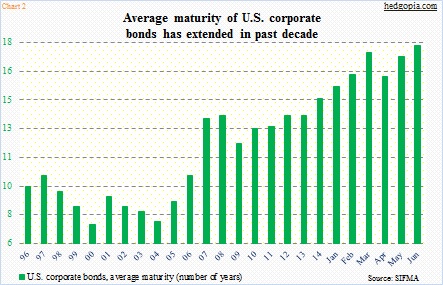
With that said, one thing they have done a good job of is the following: The average maturity of corporate bonds has persistently gone up in the past decade, and obviously throughout this cycle. In June, this jumped to 17.8 years (see chart 2 below). As well, in the past decade, the share of fixed versus floating has consistently gone up, to three-fifths of the total (not shown here). Both these factors are positive regarding the slew of corporate bond issuance.
The overriding issue nonetheless is the sheer issue of corporate bond issuance.
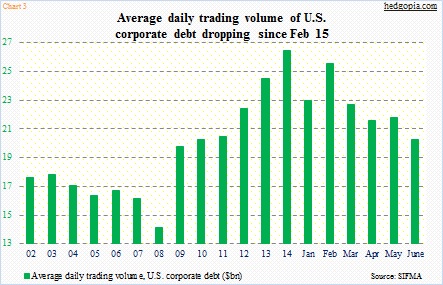
Over the years, the corporate bond market has seen it all – the good, the bad and the ugly. The excesses that took place to fund shale oil/gas projects, for instance, are coming home to roost. Energy bonds that were trading in the 60s and 70s are now trading in the 20s and 30s. All of a sudden, buyers have gone on the sidelines. Who wants to catch falling knives anyway? Coal and iron ore, among others, are in the penalty box as well. Liquidity has dried up.
Chart 3 highlights the problem very well. The average daily trading volume of U.S. corporate debt was $20.5 billion in June, down from $26.7 billion in 2014 (see chart below).
It is worth remembering that banks have gotten rid of proprietary trading desks as well as reduced market-making operations. Increasingly these days, mutual funds play bigger roles in corporate bonds, and their source of funds is retail, which tend to be fickle. How they react in times of distress will decide whether or not what is unfolding in the energy sector is a preview of things to come in corporate bonds – in the future.
Thanks for reading!
Twitter: @hedgopia
No position in any of the mentioned securities at the time of publication. Any opinions expressed herein are solely those of the author, and do not in any way represent the views or opinions of any other person or entity.


 Testing Important Price Support")
")
