Value investors are known for well-timed stock purchases that allow them to hang tight over time, rather than performing the tricky skill of trading in and out vehicles. Getting in at the right time, I believe, requires a keen eye and strong technical skill set.
The first step in this process is to understand where the market might be in its current business cycle, followed by understanding sector rotation.
In one of my first articles, I discussed that from a secular perspective, the market appears to be in the early stages of a secular bull. And earlier this week, I followed up with a look at the market’s sector rotation behavior over the last five years. From this study we concluded that we are either in a late bear or early bull stage of the market cycle.
At the early onset of this uptrend in December, breakouts from the cyclicals signaled improvement in the economy. The automakers broke out and home-builders made continuation breakouts.
Sleeping giants in the technology sector, e.g. Yahoo (YHOO) and Hewlett-Packard (HPQ), woke-up through sector rotation to technology, and chipmakers continued their uptrend that began at the end of summer 2012. While many in the market, including myself, expected a correction in April, we instead saw a new round of breakouts from weekly bases including those from “first” bases. The new entrants to this leg of the uptrend include transports and retailers.
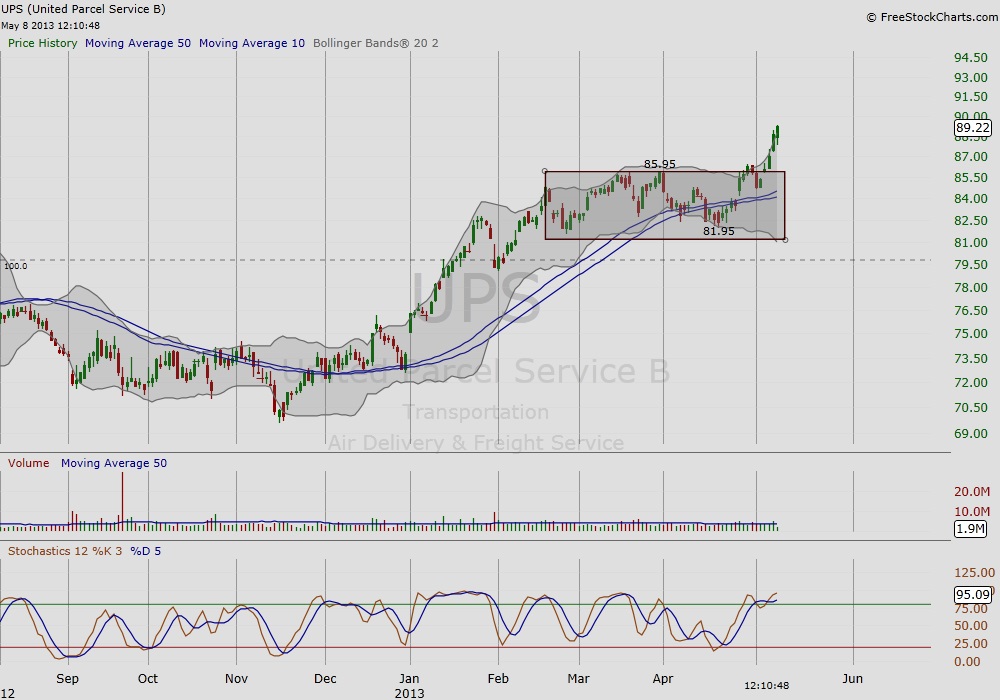
In my opinion, the Transports move signals that we are now heading into early bull market territory. Fedex Corp (FDX), shown in Figure 1, initially broke out in January following strong late year sector rotation into Transports, but sold-off sharply in late March. FDX found support at its 10/50 weekly ma, and volume declined while it rebuilt another base to try again. On the daily chart in Figure 2, FDX recoups the 10/50 daily ma in elevated volume as it breaks out from this base. The elevated volume demonstrates market conviction. However, the chart action of United Parcels Services (UPS) demonstrates early signs that it is the stronger of the two as shown in Figure 3. Unlike FDX, which broke down and returned to first base in March, UPS corrected a mere 5% and formed a multi-week flat base. The flat base coupled with light volume during consolidation demonstrates market conviction. The caveat, UPS is near 5% from the breakout point at the high, and provides little wiggle room in the event of a likely back-test.
Figure 1 – FDX Stock Chart
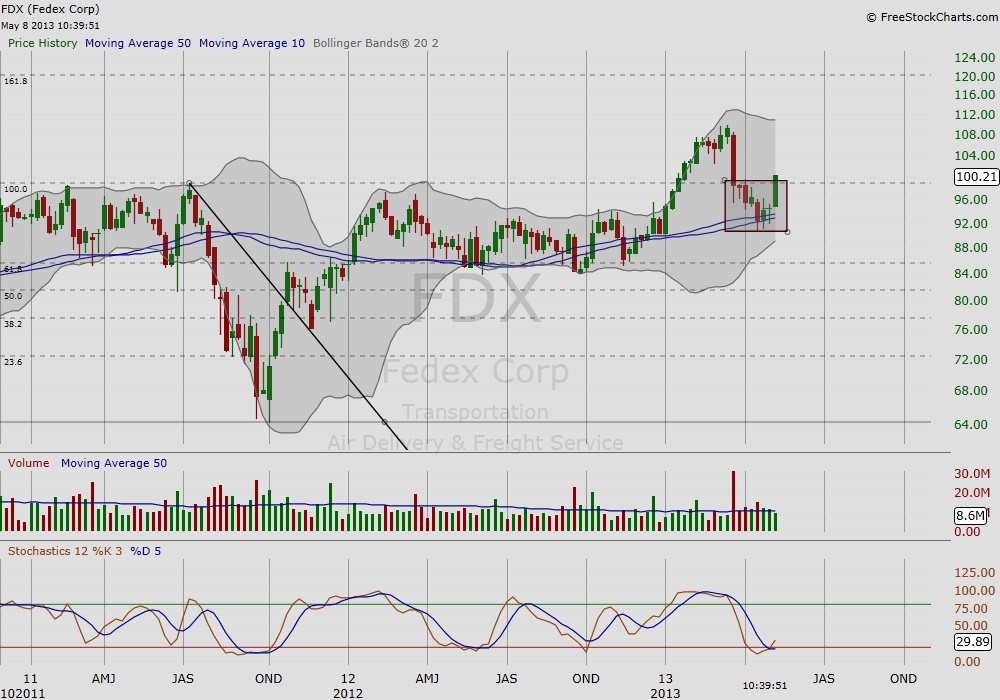
Figure 2 – FDX Breakout
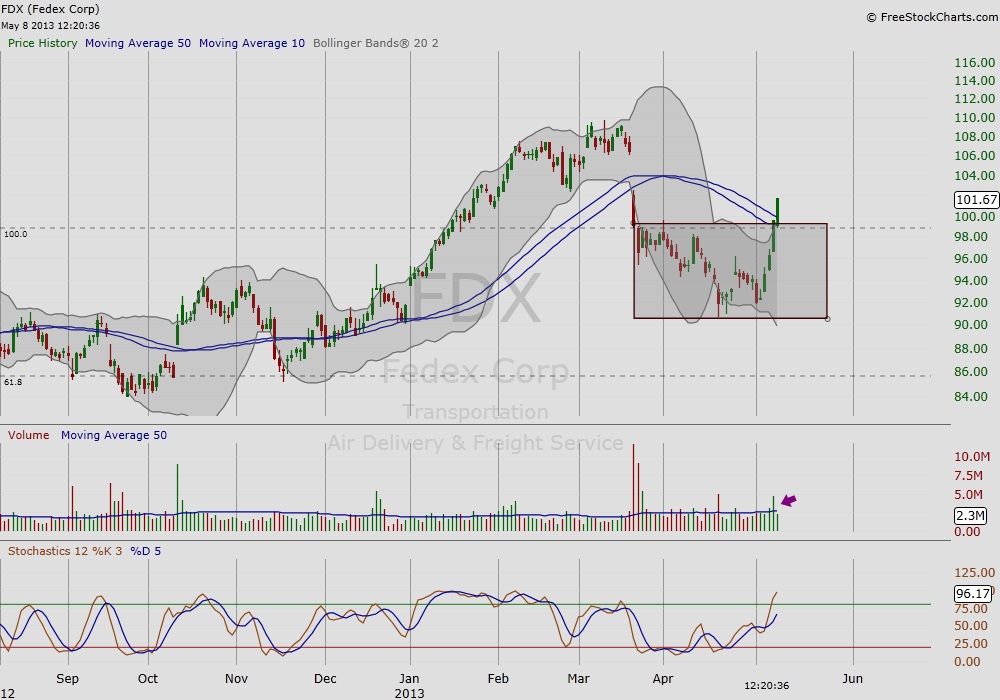
Figure 3 – UPS Breakout Chart
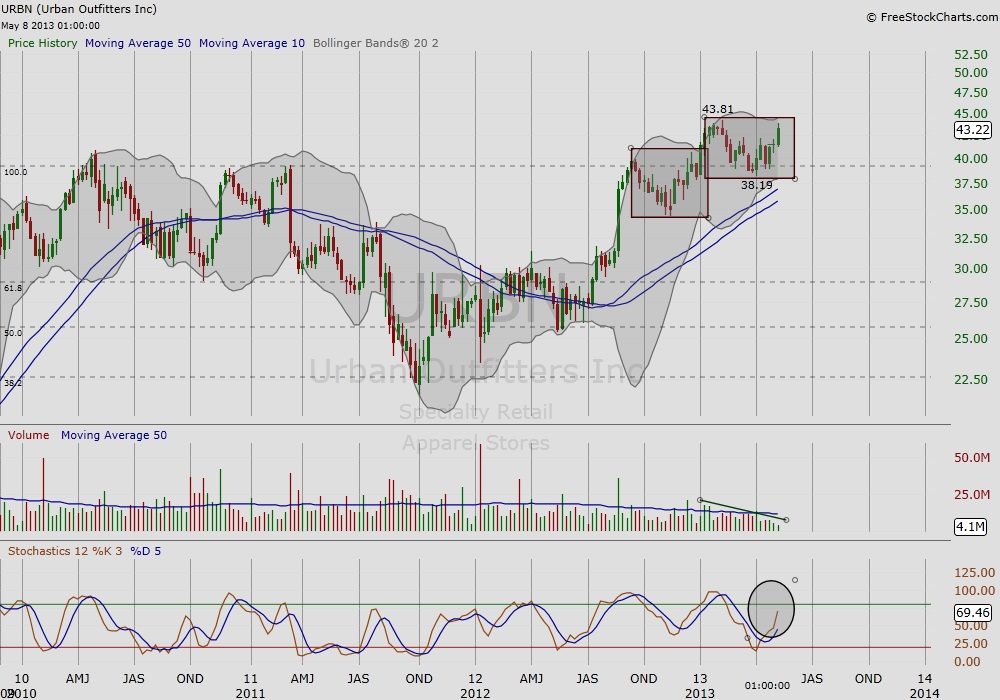
The next two charts are of retailers Fossil Inc. (FOSL) and Urban Outfitters Inc. (URBN). Like the carriers, these retailers have moved relatively sideways since topping in 2011. Recently both stocks recovered their 10/50 weekly ma, and build new bases to demonstrate the potential of new trends in this sector. URBN shows stronger chart action; it is at all-time highs and volume declined over the last three weeks during consolidation. All-time highs mean there is less risk of sellers looking to break even, and declining volume before an actual breakout is a sign that there is less risk of weak hands if and when it trends after a breakout. A reminder that a good breakout is one in elevated volume as a show of market conviction behind the move.
Figure 4 – FOSL Stock Chart
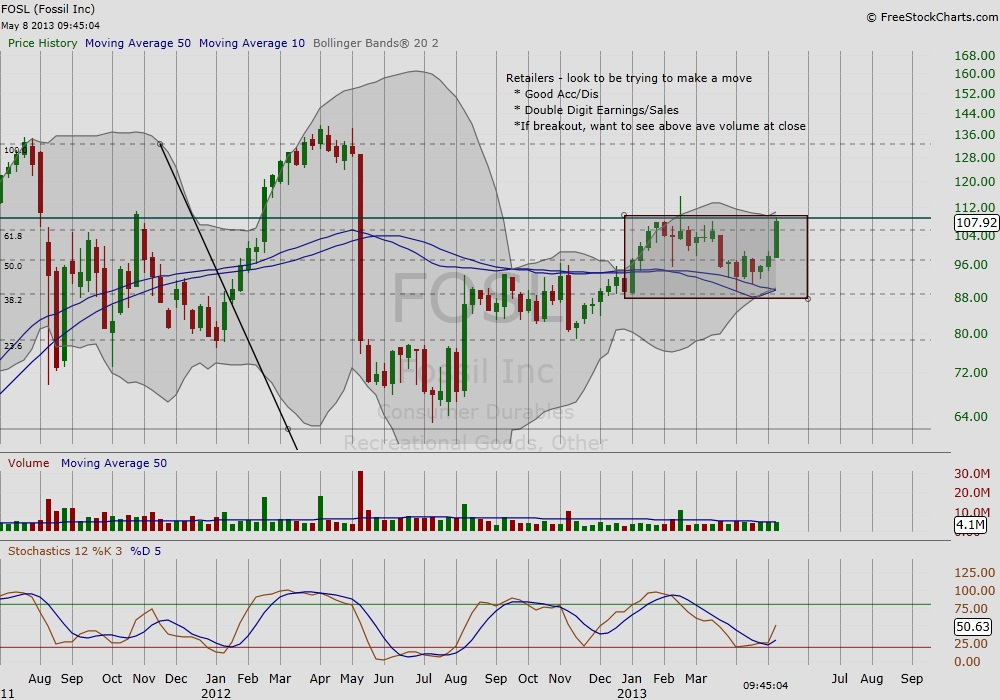
Figure 5 – URBN Stock Chart
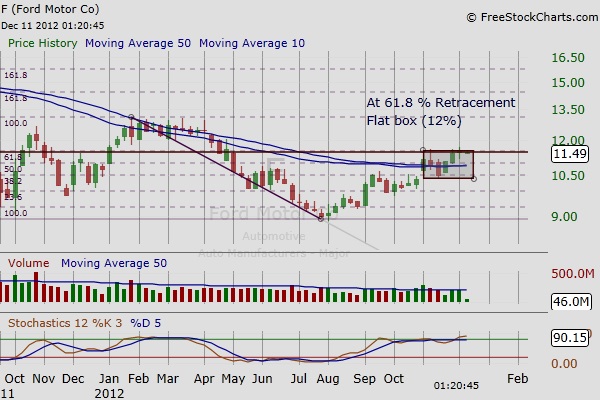
The last two charts are of Yahoo Inc. (YHOO) and Ford Motor Co. (F) at their first bases early in this six-month long uptrend. YHOO moved relatively sideways for four years until recently (boosted by sector rotation back to technology). And looking at F, similar to some of the stocks above, it has done little since peaking in 2011. There are no guarantees how long this new leg in the uptrend will continue. The uptrend is now six months old, and many traders are nervous. However, noting who might be building new bases today or those who built new bases earlier when this uptrend began will offer important clues about who to continue watching if this uptrend is cut short.
Figure 6 – YHOO Stock Chart
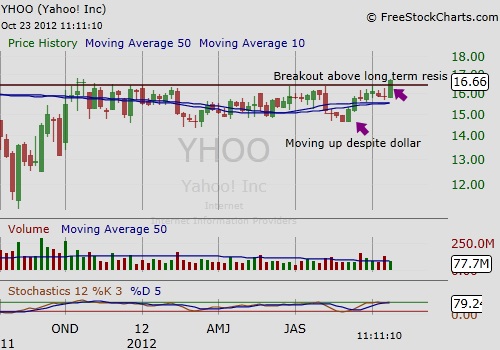
Figure 7 – F Stock Chart
Twitter: @RinehartMaria and @seeitmarket
No position in any of the mentioned securities at the time of publication.
Any opinions expressed herein are solely those of the author, and do not in any way represent the views or opinions of any other person or entity.

: Showing Some Signs of Emerging Strength")
