 Over the last couple of weeks the outsized trouncing that small cap benchmark Russell 2000 (RUT) continues to deliver versus its large cap peers year-to-date has been a consistent theme of discussion here (see this and this) and elsewhere. Epitomizing its leadership in a mature and enduring bull market, the Russell 2000 is about to print its 48th consecutive weekly close above its 50-period Simple Moving Average (50SMA).
To examine the implications of this seemingly rarefied scenario, I set up a simple study reviewing occurrences in the 2000s in which the Russell 2000 attained 40+ weeks closing above its 5oSMA, lowering the bar modestly to sweep in a larger sample. With the caveat kept in mind that as an already outlying scenario the rate-of-occurrence of these market readings is low, the results are shared below.
The study sought to answer two questions:
What were the vertical (performance) and horizontal (time) results for the Russell 2000 after registering 40 weekly closes above the 50SMA historically? And what projections – if any – are available based on those results?
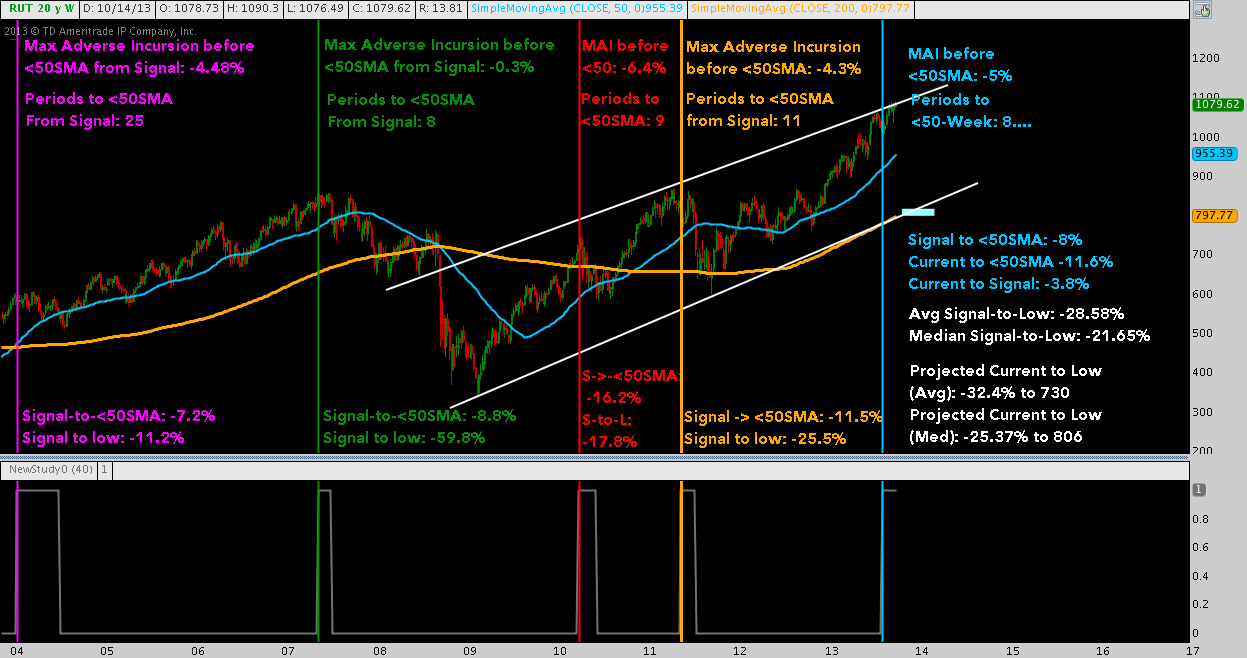
Over the past 10 years, RUT clocked 40+ weekly closes above its 50SMA (the “signal”) on 5 occasions: January 2004; May 2007; April 2010, May 2011; and August 2013, which is currently underway. An astute eye will already catch that each of these dates preceded a legitimate market correction (i.e. -10%+ from price peak-to-trough).
Once this threshold is crossed, the following has occurred historically:
- The index crosses below its 50SMA 13 weeks later, on average
- The maximum adverse incursion (MAI) – i.e., the amount the index moved up – after the signal is given: 3.8% average
- the distance from the signal week’s close to first close <50SMA average -11.93%
By comparison, here’s how the current occurrence stacks up:
- Periods since the signal: 8 (ongoing)
- Maximum adverse incursion to-date: -5%
- Distance from the signal week’s close to first close <50SMA: -11.46%
In other words: it’s been almost 8 weeks since RUT hit 40 consecutive closes above its 50-week simple moving average. Since that close (at 1038), RUT advanced another 5%, to 1090. From that 1038 close, the distance to the 50-week simple moving average is currently 8% or 83 points. As you can see: Today’s period of “40+ weekly closes >50SMA” is roughly consistent the four preceding it.
Russell 2000 (RUT) – Weekly: “40+ Consecutive Weeks >50SMA” Study (click image to zoom)
What can we extrapolate about what comes next?
On Price:
- Given the 13 week average from signal to <50SMA, RUT is projected to tag its 50SMA in approx. 5 weeks.
- The current signal-to-<5oSMA of -8 from 1038 projects this will occur near 955: -11.6% from 10/15/13’s close at 1080.
Thus far, this implies a market correction to approximately 955 in the back half of November.
Now some additional datapoints:
- The average price decline from the signal to the subsequent price low below the 50SMA: -28.58%
- The median price decline (buffering 2008’s outlier) form signal to subsequent price low below the 50SMA: -21.65%
Adding the current distance to the signal of -3.8% to these figures, we are able to project some rough market correction targets:
- From yesterday’s close, the projected distance to the ultimate price low based on the average signal-to-low: -32.4%, or 730
- From yesterday’s close, the projected distance to the ultimate price low based on the median signal-to-low: -25.37%, or 806
On Timing:
- Average time from signal to the ultimate price low in weeks: 37.5. This includes a 92-week outlier between May 2007-March 2009.
- Median time from signal to the ultimate price low in weeks: 21.5.
RUT‘s active signal is in week 8, suggesting a bottom would occur between 13.5 (median) and 31.5 weeks away.
- The median time projection from now to the ultimate price low: mid-January 2014
- The average time projection from now to the ultimate price low: early June 2014
Pulling this all together, Russell 2000‘s active signal at 48 consecutive weeks above its 50SMA projects a 25.37-32.4% market correction (a true bear market, where the bottom would occur in that band), culminating in a low between 730-806 between mid-January and early June 2014.
Those are wide and unwieldy ranges, true; but this far out in price and time the objective should not be to dial in exact vertical and horizontal targets – the number of variables that may intervene would make concrete values all-but arbitrary. At this distance, the general implications yielded by the study are more than adequate: Russell 2000 is a small handful of weeks away from beginning a major corrective phase that will play out over the next 3-7 months.
Of particular interest in the context of Russell 2000‘s current position at channel resistance is the proximity of the 200-Week SMA (currently 798) and cyclical rising channel support to the latter target at 806. This scenario vividly recalls 2011’s August-October drop, which just eclipsed a -20% peak-to-trough move; installing a major correction; yet maintaining the cyclical bull market’s primary up-trend.
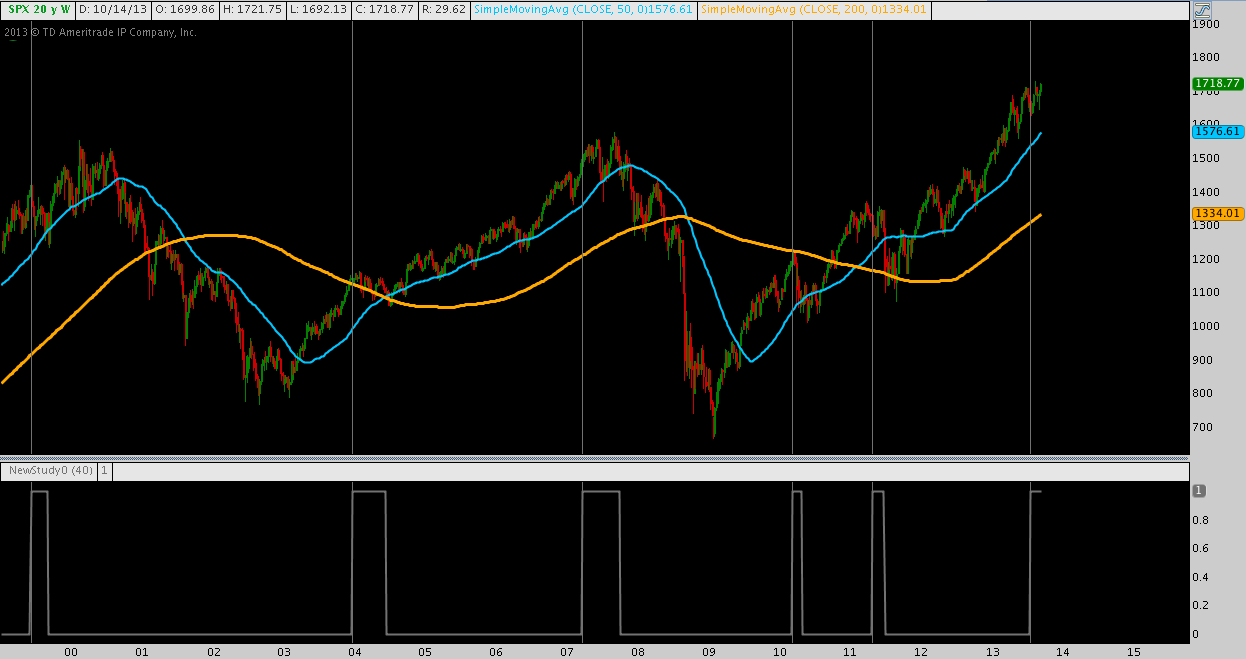
Bonus: because SPX is more widely followed and referenced, here’s the raw chart for the same study, going back to 2000.
S&P 500 (SPX) – Weekly: Marking 40+ Consecutive Weeks >50SMA (click image to zoom)
Twitter: @andrewunknown and @seeitmarket
Author holds net long exposure to Russell 2000 at the time of publication.
Any opinions expressed herein are solely those of the author, and do not in any way represent the views or opinions of any other person or entity.


