Russell 2000 Futures: Some Perspective On The ‘Trump’ Spike Lows
All major U.S. stock market indexes have been on a tear since the election night reversal. But one that really caught my eye was the Russell 2000.
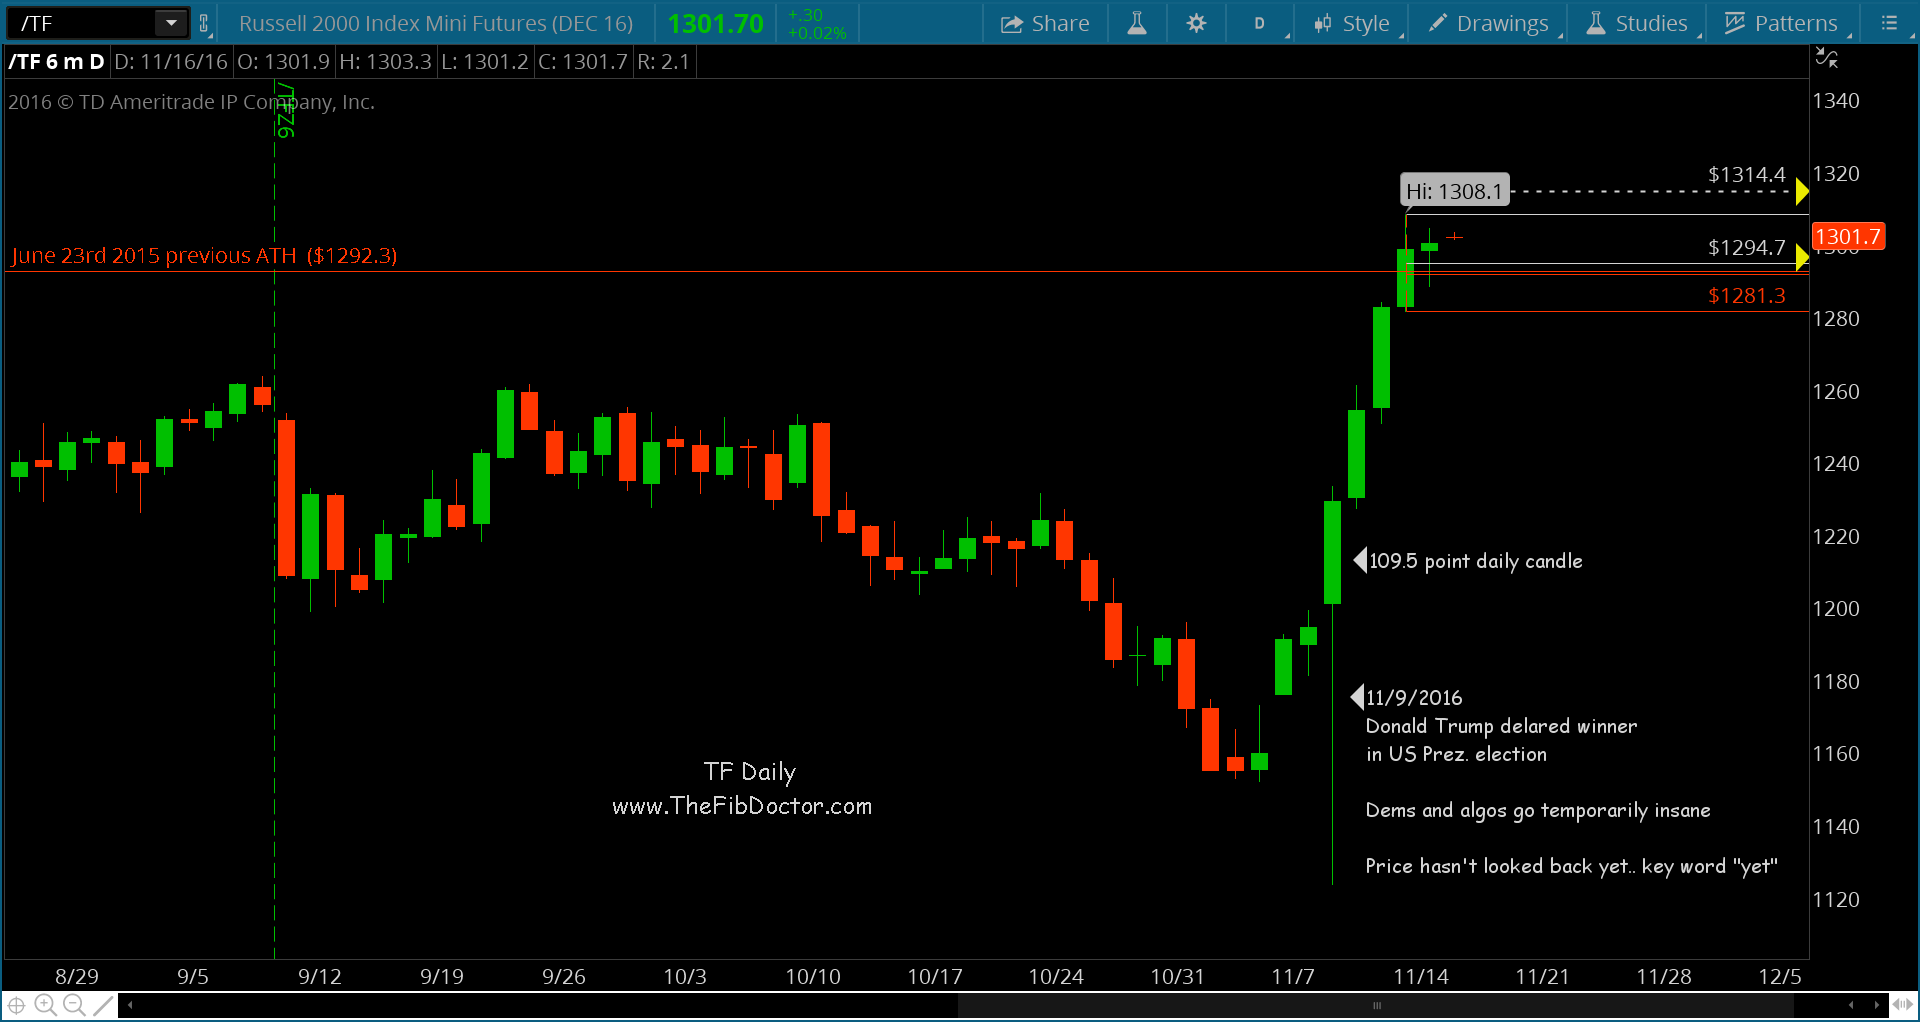
Looking at the Russell 2000 futures chart below, you can see that big ole candlestick wick during the night of the presidential election. From lows to highs, that single candlestick measured 109.5 points. Whoa!
Ultimately, that reversal worked like a slingshot to help propel the Russell 2000 out of a danger zone and up to all-time high levels from June 2015. This area (up to 1314) may act as resistance near-term. Put it on your radar.
All told, the rally from the Russell 2000 Trump spike lows to the current highs has been 16.42%. How the index reacts here will be an important ‘tell’. Stay tuned.
Russell 2000 Futures Chart – Rally Perspective
Thanks for reading. Note that you can get more of my trading insights and Fibonacci analysis at Bottom Line Trades.
Twitter: @TheFibDoctor
The author may have a related position at the time of publication. Any opinions expressed herein are solely those of the author, and do not in any way represent the views or opinions of any other person or entity.


: Showing Some Signs of Emerging Strength")
