Market technicians like finding and pointing out divergences whether they are bullish or bearish, myself included. That is why I would like to discuss using the RSI indicator in a different light and what I see developing in small caps, represented by the Russell 2000 ETF (IWM). More specifically, I’d like to discuss RSI reversals.
Using RSI reversals to forecast a price objective was discovered by Andrew Cardwell, a leading authority, if not the leading authority on the Relative Strength Index. In Constance “Connie” Brown’s book Technical Analysis for the Trading Professional, she devotes a whole chapter to Cardwell’s work and the process of deriving price objectives from positive and negative reversals in RSI. I will touch on some of the key elements she explains, but it would serve one well who has an interest RSI reversals to do more research or read Brown’s book.
The premise of RSI reversals is that when the RSI makes a higher high, but price doesn’t make a new high there is negative reversal and a lower price objective can be calculated. The same is true when the RSI makes a lower low, yet price does not confirm that low. This is an instance of a positive reversal and a higher price objective can be calculated. When calculating these price objectives, closing price is used. Using arbitrary letters as W for the first RSI pivot, X for the second pivot, and Y as the high/low extreme in RSI that separates these points I will give the formula for calculating a price objective. Being that I’m a visual person as most technicians are, I will use a weekly chart of IWM to demonstrate this process (see below).
IWM Weekly Chart
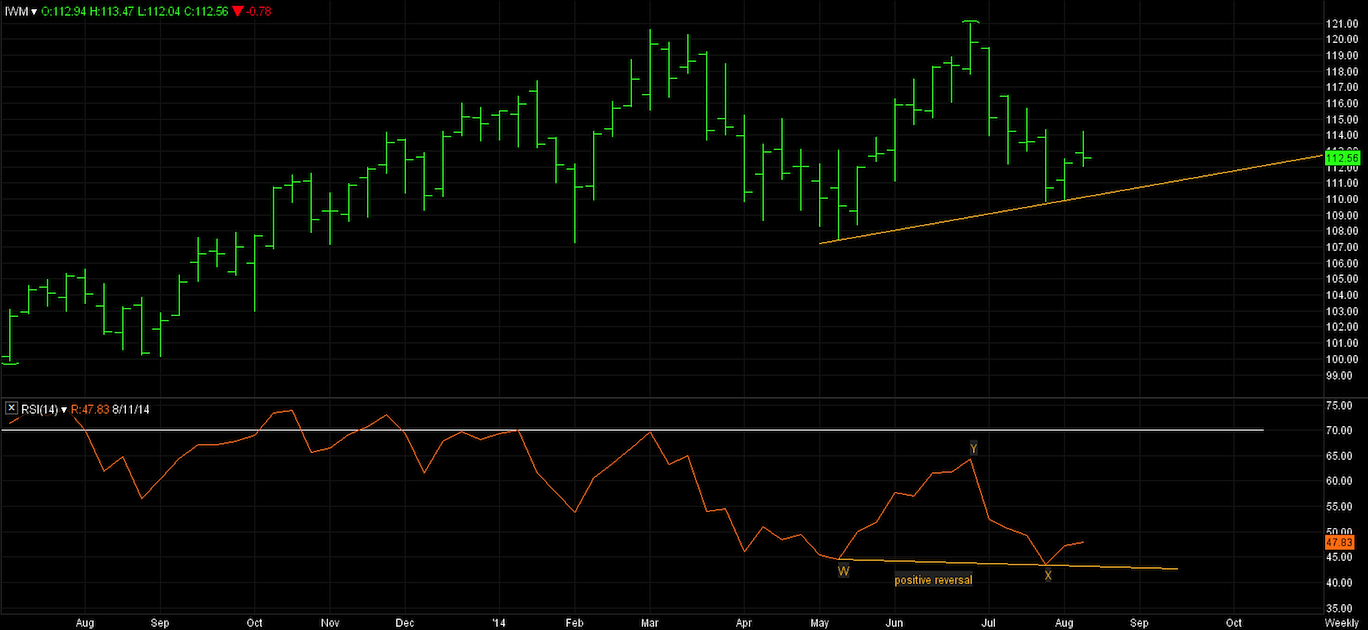
The RSI has made a new low at point X with price closing at 110.68 However, that is a higher price then 109.57 point W on the RSI. We take the difference in price which is 1.11 and add(because this is a positive reversal) to the closing price 119.82 at point Y, the high of the oscillator and come up with a price objective of 120.93 So for positive reversals, the formula is:
(X-W) + Y = price objective
For negative reversals, the formula is:
Y-(W-X) = price objective
So do RSI reversals always work? No, nor do any indictors. What is important for this discussion is the signal is negated once the trend line in RSI is penetrated. The RSI reversal is not one of my primary tools, but I do like having it in my toolshed. My thoughts on IWM, is we are currently range bound between 107 and 121, but this positive reversal can lead to a test of 121 and potentially lead to a breakout.
No position in any of the mentioned securities at the time of publication. Any opinions expressed herein are solely those of the author, and do not in any way represent the views or opinions of any other person or entity.
: Showing Some Signs of Emerging Strength")


: Showing Some Signs of Emerging Strength")