 By Andrew Nyquist
Once again, I want to thank the many readers that take the time to send in comments and questions each week. As most have witnessed, the past few days have been rough for the financial markets, and in particular, commodities and commodity related stocks. But some have struggled more than others… enter the coal sector and Arch Coal (ACI). Thanks to Reader David, this will be the focus of our Reader Radar segment for this week. So where is the love for Arch Coal?
Andy,
I’ve seen Arch Coal (ACI) pop up a few times in your articles. I think the stock has good potential longer term but am getting frustrated as the stock price continues to struggle. Can you perform some technical analysis to show how one might play this stock?
Thanks,
David
David,
Thank you for your question. I too have felt the frustration of owning ACI in the past, but this is why we always want to have a plan when purchasing stocks… and one with risk management (i.e. stops), especially if you are an active investor or an overly emotional investor. Over the past year, I’ve been stopped out a few times for small losses, and likewise took a couple quick gains. But all along I thought ACI was a winner. I needed to detach myself emotionally to avoid losing big bucks. This speaks to the heart of technical analysis and its value. I am thankful I have used this gift to formulate sound investment plans, both short and long term. If an investor is buying stocks, regardless of timeframe, it is important to identify short and long term support and resistance. And make a plan (and revisit this plan).
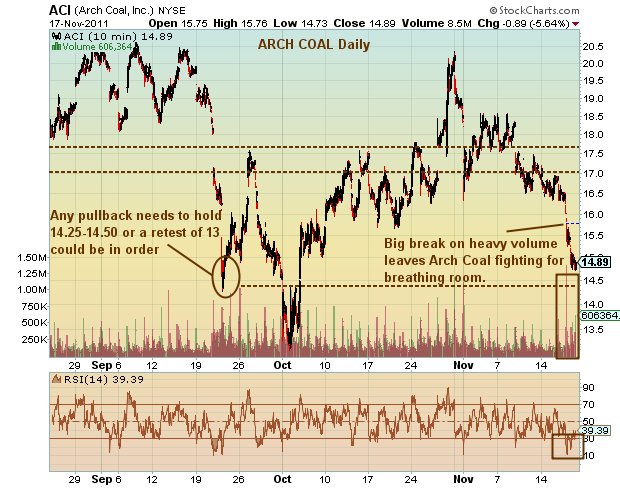
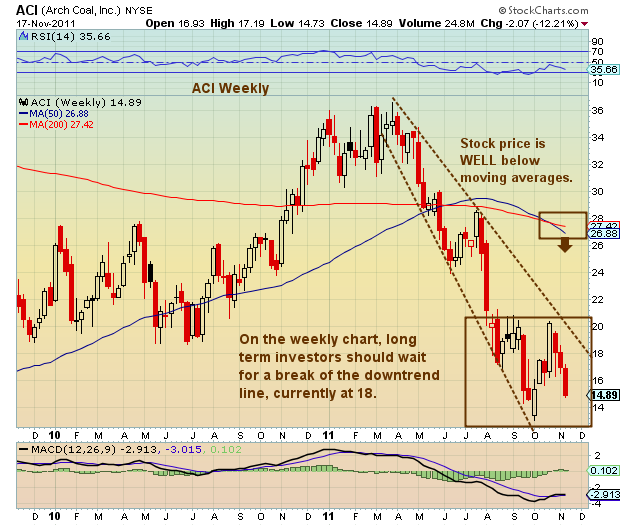
On the short term side, I see an oversold stock that has fallen fast on heavy volume (see 1st chart below). The pullback off 20ish was to be expected, but the breakdown below 16-17 is a warning. The next support is 14-14.50, which is currently being tested. If this breaks, then a retest of the lows is likely. On the long term side, the stock is very oversold at 3 to 4 standard deviations below its moving averages. A break above the declining channel (currently at 18) will be the first signal that all is clear longer term.
Thank you for your question David, and thank you for reading See It Market.
Andy
———————————————————
Your comments and emails are welcome. Readers can contact me directly at andrew@seeitmarket.com or follow me on Twitter on @andrewnyquist. For current news and updates, be sure to “Like” See It Market on Facebook. Thank you.
No positions in any of the securities mentioned at time of publication.
Any opinions expressed herein are solely those of the author, and do not in any way represent the views or opinions of his employer or any other person or entity.


