With the first quarter nearly in the books, we have successfully logged 60 trading days so far this year and some might say that it has been a frustrating journey. The most notable thing that can be said about 2015 is that market volatility is back and may be here to stay for the foreseeable future.
Breaking it down by the numbers, we have had 19 days with percentage moves in excess of 1% in either direction. That represents nearly one-third of all activity, with another handful of days barely missing the cut.
12 of those big percentage moves have been in positive territory, with the average gain being 1.30%. The 7 down days averaged pernicious drops of 1.45% each.
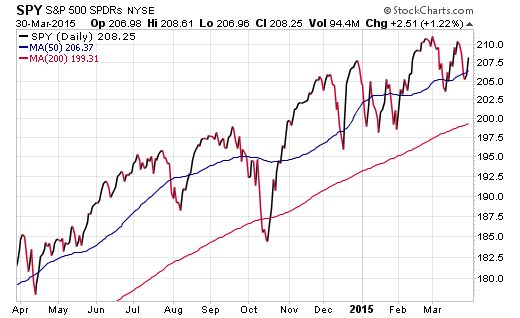
The end result of course has been a very choppy and indecisive start to the year. As of March 30, the SPDR S&P 500 ETF (SPY) has gained just 1.77% in total return. On the whole, that seems like an okay start to the year. However, it was just barely hanging on to positive territory before Monday’s gain of 1.22%. But that type of market volatility highlights the norm over the past few months.
S&P 500 ETF (SPY) Chart
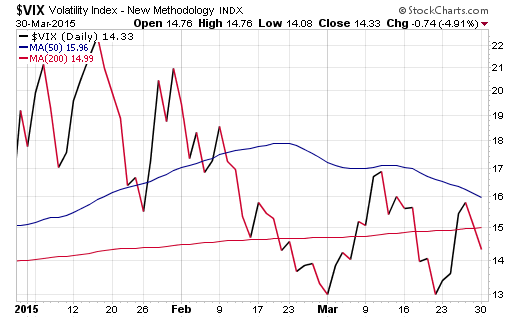
A look at a year-to-date chart of the CBOE VIX Volatility Index (VIX) shows just how quickly investors are switching from greed to fear on a weekly basis. The tumultuous price action has certainly been a catalyst for traders to capture short-term profits, but has likely damaged confidence in the up-trend for those that are worried about the health of the bull market.
Volatility Index (VIX) Chart
So where do we go from here and how do you adjust your portfolio to take advantage of this uptick in market volatility?
In my opinion, it all comes down to your investment style and risk tolerance.
Those with more aggressive styles will likely be focusing on short-term trades in the market in addition to carrying high cash positions as a risk managed approach. The upside of this strategy is that you aren’t holding large concentrated positions that may be susceptible to a broad-based round of selling from lofty valuations. However, you will also likely be left with underweight exposure during any overnight gaps higher that the market is prone to dish out.
Those with a more balanced or traditional approach that are looking for new investment ideas may want to consider a fund such as the iShares MSCI USA Minimum Volatility ETF (USMV). I own this fund in my own account for several reasons:
- It is a high quality portfolio of 155 stocks with overweight holdings in health care, financials, technology, and consumer staples.
- The expense ratio is a paltry 0.15% for access to a fundamentally screened portfolio of stocks.
- USMV has kept pace with SPY over the last 3-years and continues to maintain a lower overall equity beta of 0.79.
- A fund of this nature is designed to minimize price fluctuations, while keeping a higher correlation to stocks than a multi-asset or alternative style investment.
While USMV won’t save you from the next bear market, pairing it with a stop loss or sell discipline to sidestep a prolonged downtrend may prove to be a successful risk management strategy. Ultimately, no one knows where the market will go from here, but implementing a decisive plan will be indispensable to navigating this choppy environment and keeping your sanity intact.
Follow Dave on Twitter: @fabiancapital
Author has a long position in USMV at the time of publication. Any opinions expressed herein are solely those of the author, and do not in any way represent the views or opinions of any other person or entity.


