It’s a privilege to be the next guest blogger in the Market Masters series that Andy Nyquist has put together. When considering topics I figured now would be as good a time as ever to talk about a few tools that we use to set price targets when markets are already at all-time highs. Usually we prefer to use former support and resistance levels to take profits or add to positions. But if that doesn’t exist, we need other tools.
Today we’ll focus on two strategies that we can employ in such scenarios. The first one is the underrated measured move. Price pattern recognition is one of the older methods used by technical analysts. Robert Edwards and John Magee were writing about these patterns back in the 1940s. Typically, we’ll take the height of the pattern, or consolidation, and then add that to the breakout level, giving us a price projection. In this case, let’s use the S&P500 as an example, as we’re already well above any previous resistance levels throughout history.
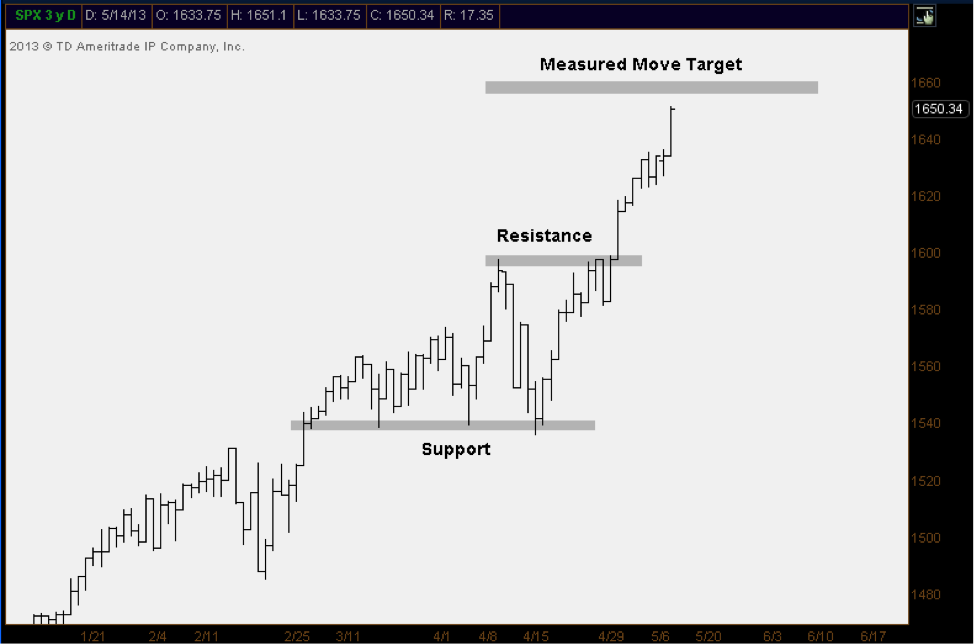
As we can see in this daily bar chart, 1538 was support for the S&P500 during March and April. About 60 points higher S&Ps ran into resistance during the month of April. This 60 point range gives us an eventual price target of just under 1660 based on that one pattern. This helps us recognize that there is potential resistance at these prices even though the index has never traded up there.
Measured Move – Identifying Price Targets
The second price projection tool that we’ll look at today is the Fibonacci Extension Target. During uptrends, markets tend to correct between 38.2% and 61.8% of their primary move before then continuing to make fresh highs. In downtrends, the opposite is true as prices tend to rally to between 38.2% and 61.8% of their previous sell-off before rolling over to make new lows.
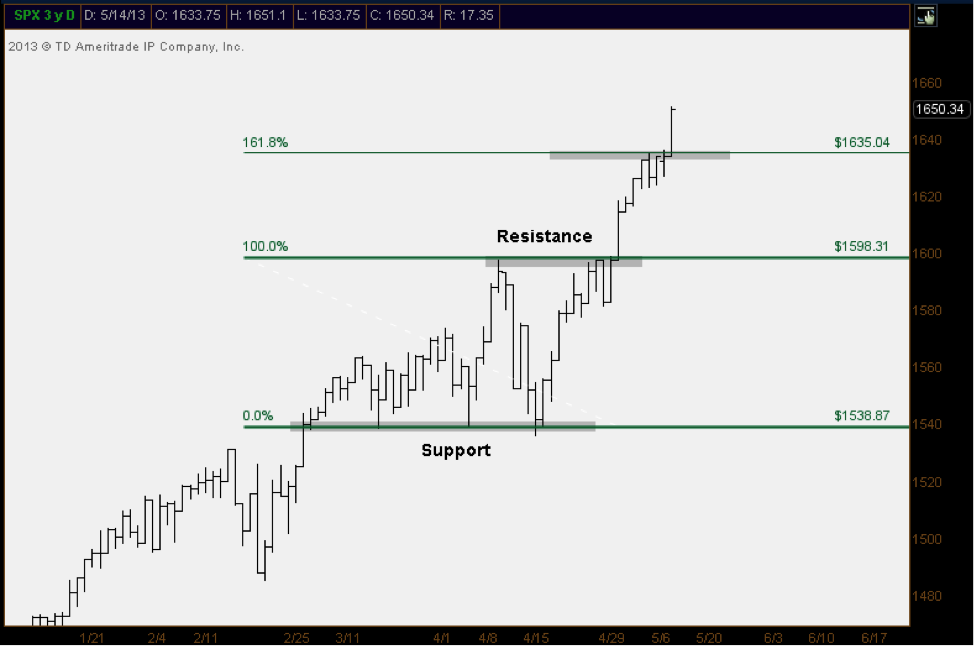
But when it comes to price targets, we’ll look for a move 161.8% of size the most recent correction. In the case of the S&P500, this most recent correction came from those same levels we mentioned above. The April 11 highs just under 1600 down to those March/April support levels just under 1540. That 60 point move that we discussed earlier gives us a Fibonacci Extension target up in the mid-1630s.
And sure enough, as you can see in this chart, that is precisely where the market halted for 4 days. It kept bumping up against that level for close to a week almost as if this really was resistance from the past. Like if there was supply there from months ago. But there wasn’t. Without using these Fibonacci tools, I can’t imagine how you would anticipate that.
And that last thing that I’d like to mention about these two strategies is the sign of strength that a market shows when it reaches these price projections. Markets that are in healthy uptrends should reach these levels before rolling over. Failure to meet these targets tends to signal underlying weakness developing in what would otherwise be considered a strong trend.
Fibonacci Analysis – Identifying Price Targets
I hope this helps shed some light on a few of the things we look at to help manage risk when a market is in unchartered territory. Clearly now is as good a time as ever to go over this stuff considering where S&Ps are currently trading. But let’s remember that the beauty of technical analysis is that these tools can be applied to any market, not just stocks. Commodities, bonds and currency markets show similar supply and demand characteristics that we find in equities. So we apply these strategies across the board to help us manage risk. We can’t control how high or how low something is going to go. We can only control how much risk we’re willing to take. So we tend to focus on that.
Thanks Andy for making me a part of your Market Masters series. It truly is an honor. JC
About J.C. Parets: J.C. is a Chartered Market Technician (CMT) and a member of the Market Technicians Association. He is also the author of allstarcharts.com and has appeared on numerous media outlets such as Bloomberg and CNBC. You can find him on Twitter under @allstarcharts.
Any opinions expressed herein are solely those of the author, and do not in any way represent the views or opinions of any other person or entity.


