Amidst a market environment in which certain trades aren’t simply working well but are perceived to be without any risk whatsoever, the short Japanese Yen trade is arguably perceived to be the surest thing around.
According to CFTC’s Commitments of Traders, speculative shorts continue to amble along with negative volume around record levels:
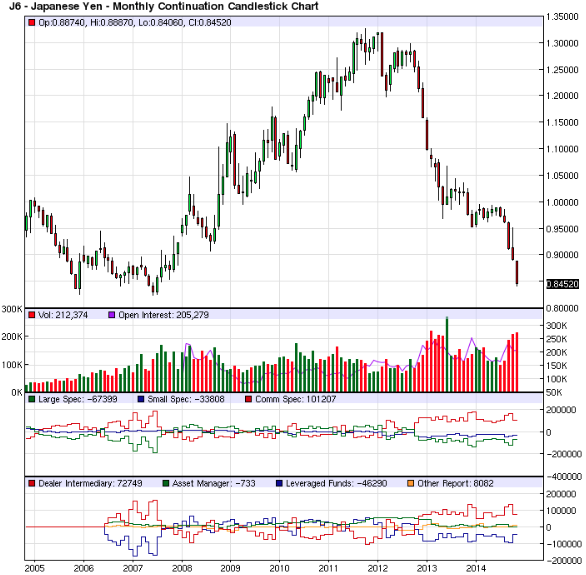
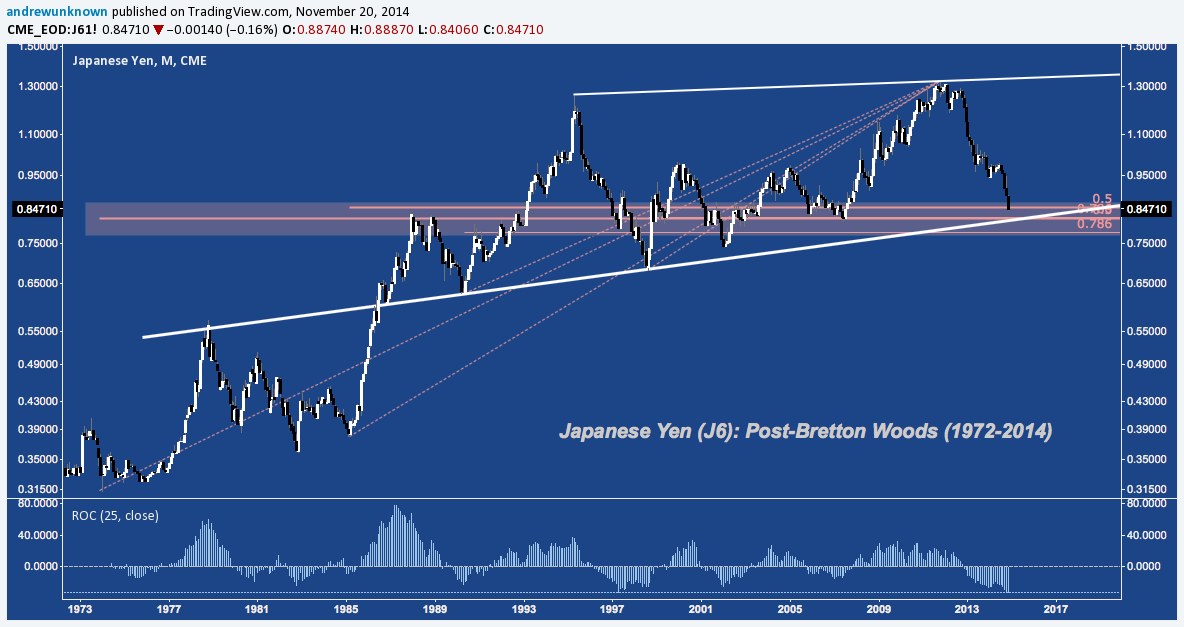
After a year-long consolidation of the massive drop that began in late 2012 with Japanese Prime Minister Shinzo Abe’s return to office and ended with BoJ Governor Kuroda’s appointment in April 2013, CME’s Japanese Yen FX contract (J6) has shed -15.65% since the end of June 2014 — with -11.65% of that decline since October 15.
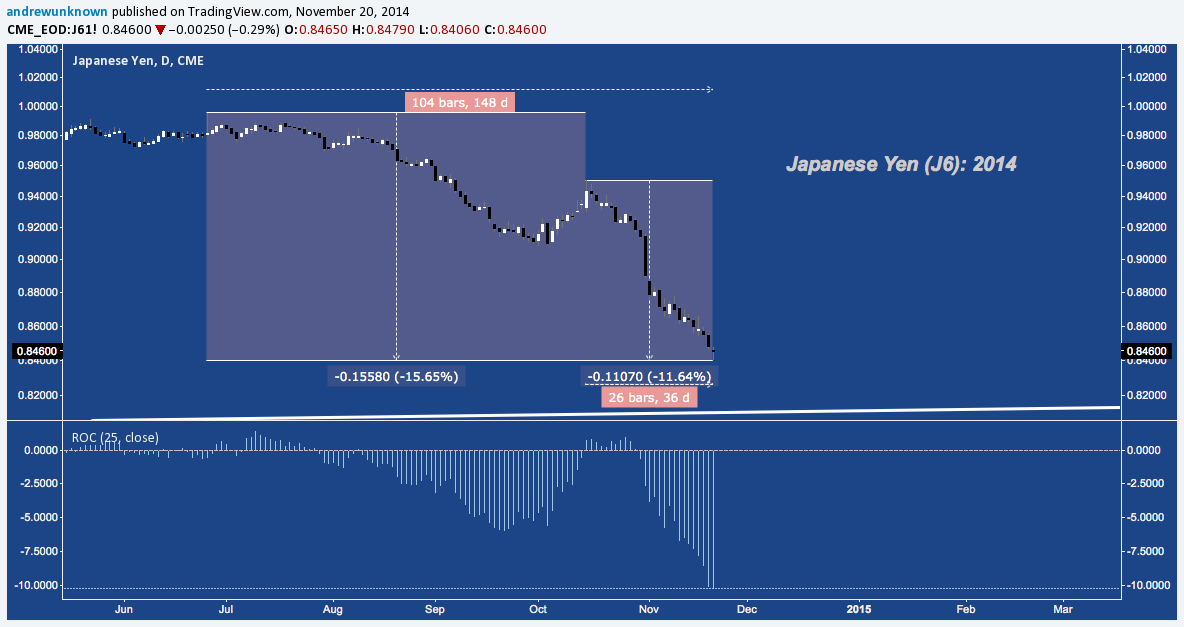
Anyone at all familiar with FX markets knows that a -11.65% decline in a single month on a G10 currency is a radically large nominal drop – not unprecedented, but rare. In the Yen’s case, you can see just how precipitous the decline is by looking at the 25-Day Rate-of-Change (RoC) in the bottom panel above, which measures from the October 15 close to the present. The already significant move down in August-September doesn’t come close.
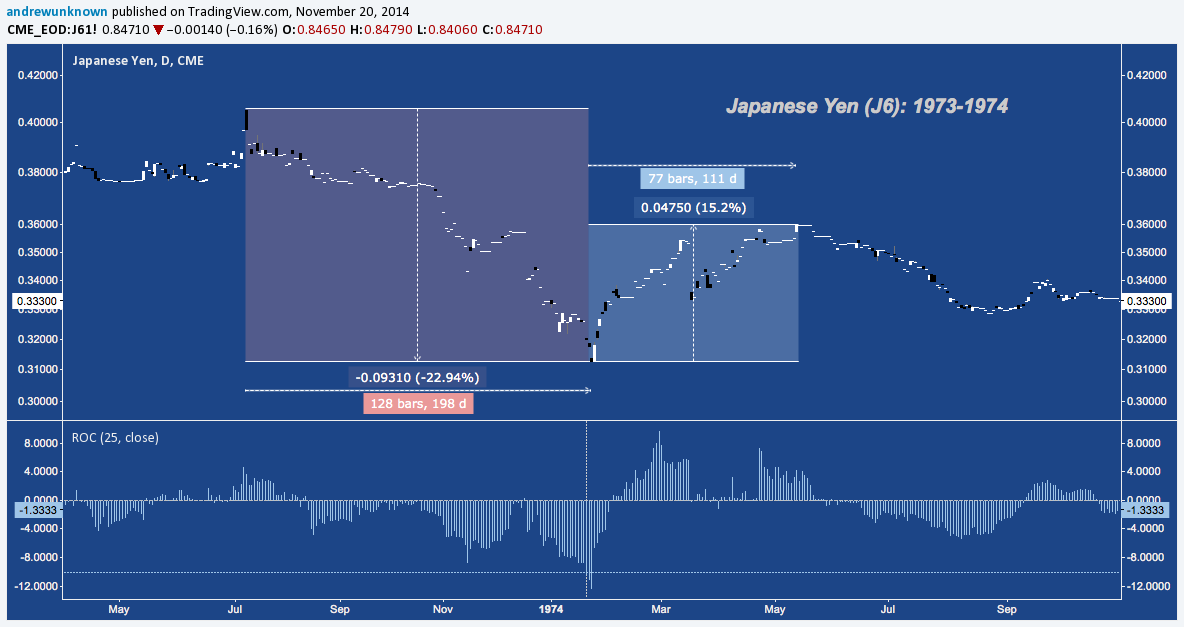
In fact, since the Japanese Yen began to float in 1972 following the collapse of Bretton Woods, yesterday’s RoC reading has only occurred 5 other times:
1973-1974:
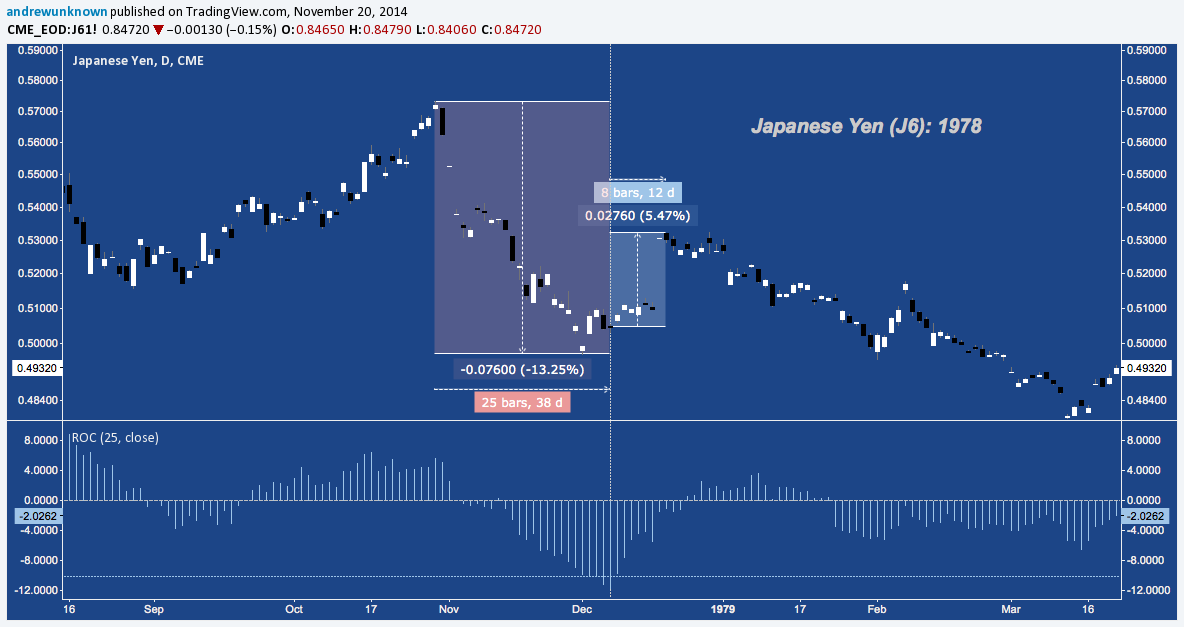
1978:
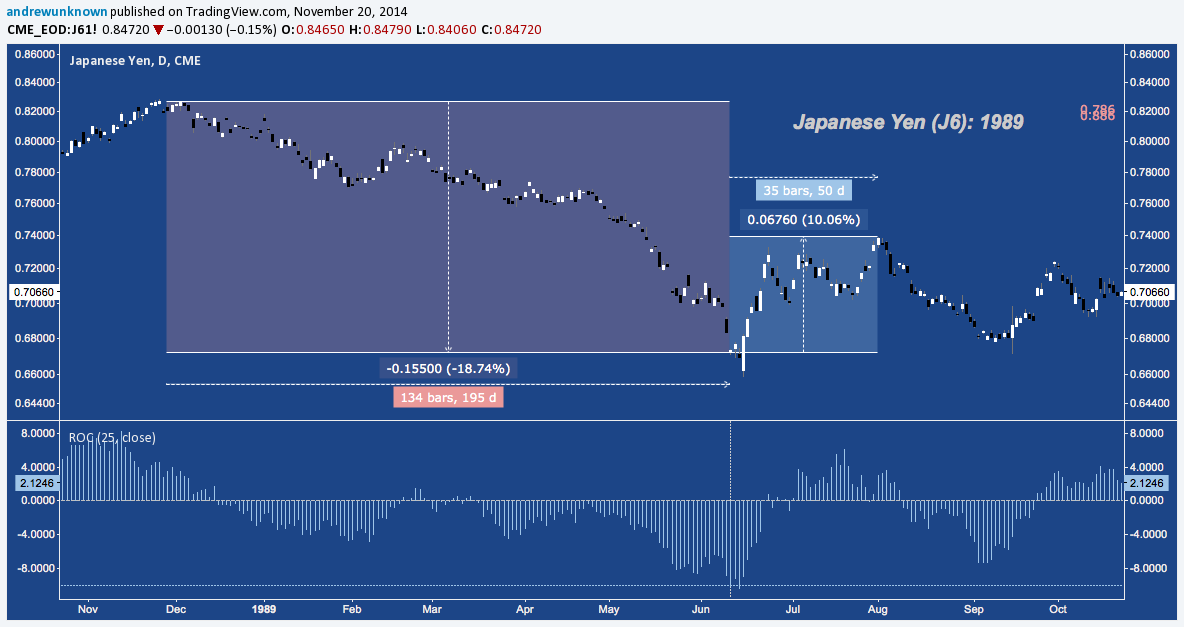
1989:
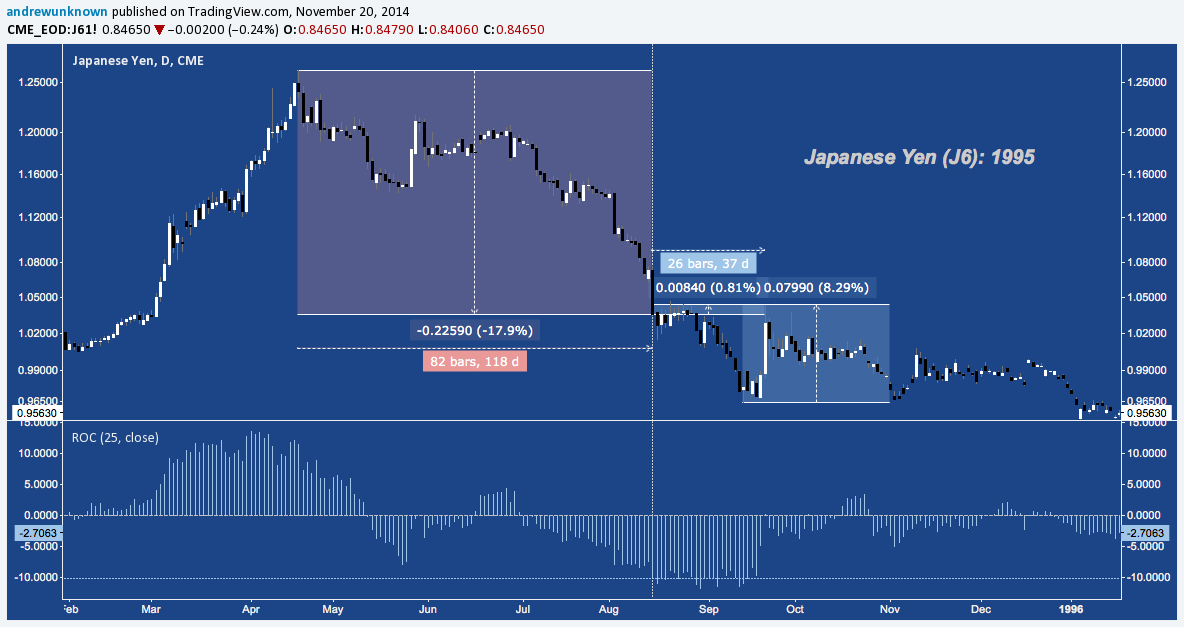
1995:
2009:
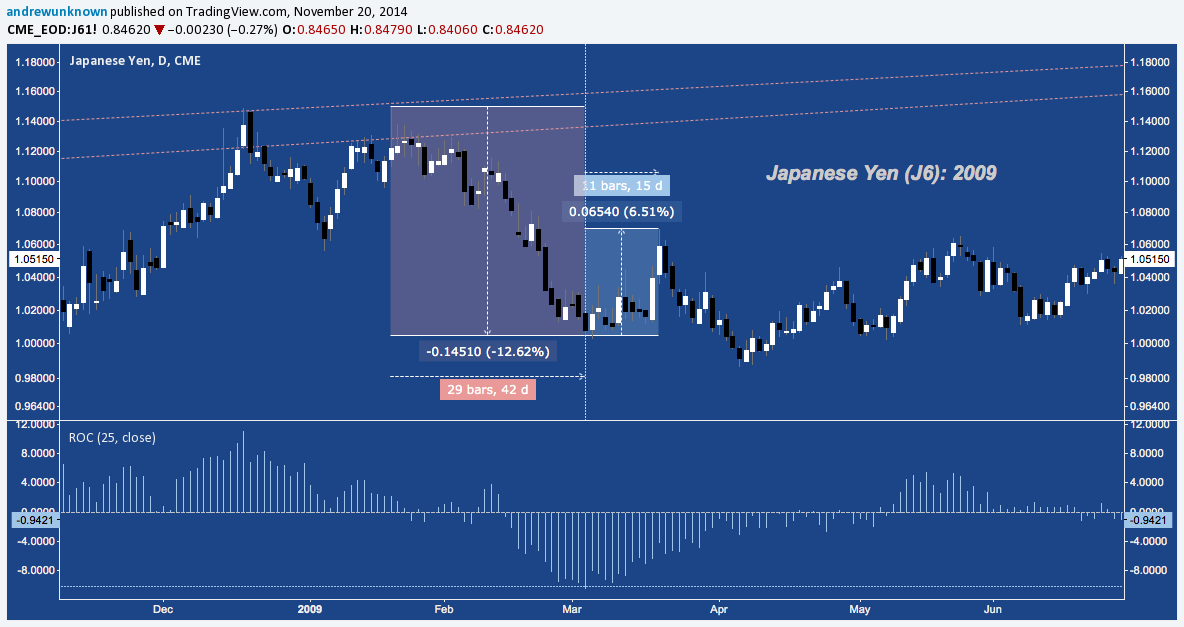
From the initial reading in each of these cases, JPY gained +7.6% in 26.4 trading days, on average. In 1973-1974 and 1989, the reading preceded the local bottom by a few sessions, whereas the JPY bottomed the sessions following the 1978, 1995 and 2009.
Some of those years may sound familiar. Most of these occur at major inflection points for US or Japanese equity markets.
- In 1973-1974, US equities were cut in half, beginning in January 1973 but not really getting underway until November, coinciding with the escalating decline in JPY.
- Less obviously, Late 1978 marked a bottom that was never breached on a closing basis again, coming toward the end of the 1966-1982 Inverse H&S Continuation pattern that triggered the 1982-1987 bull.
- 1989 coincided with the secular and all-time peak of the Nikkei225 (NKY)
- Spring 1995 kicked the best year for US equities in a generation into high gear and is the spot where the historic bull run of the 1990s began in earnest.
- Spring 2009 was the capitulation bottom that marked the beginning of 2009-2014’s cyclical bull for developed market equities.
What can we gather from this? First, a counter-trending upside move in the Yen is setting up, probably larger than anything seen since last June. Judging by the COT data, this move will be adverse to a lot of highly leveraged money, sufficient to spark at least some JPY carry unwind. Secondly, these readings are few, but where they occur do tend to coincide with tops, bottoms, breakouts and breakdowns for US and Japanese stocks, as well.
This couldn’t come at a more interesting time for the Yen. In the 25 months since Abe became PM, JPY has fallen by 1/3 against the US Dollar, closely mimicking the decline that occurred in 1995-1997. JPY’s 25-Month RoC exactly is almost identical to early 1997 – just before the Yen popped +14.4% in 2 months:
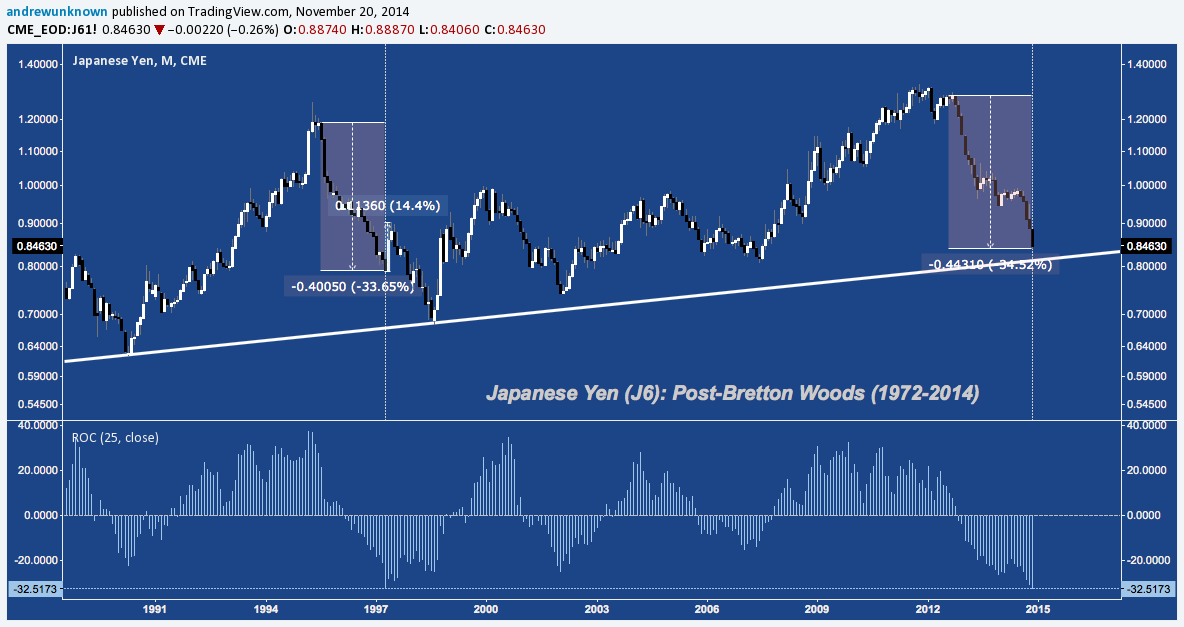
Critically, what separates 2014 from 1997 is the presence of secular trend line support just beneath. Not only is JPY only +4% versus it’s June 2007 lows, it’s just +3% above it’s 25-year rising trend line (diagonal white line, above).
Without equivocation, this level – near 0.82 on the J6 contract and approximately 120 on USD/JPY – is the site of the biggest confluence of fibonacci cluster support and horizontal support in the Yen’s history as a free-floating currency.
It isn’t just the US Dollar that the Yen is at a crossroads with. Below is a composite of Japanese Yen crosses with which I actively work featuring GBP/JPY, USD/JPY, EUR/JPY, AUD/JPY, CAD/JPY, NZD/JPY and CHF/JPY. This broader relative strength measure is at the 78.6% retracement of 2007-2009’s drop, coinciding closely with the primary target of 2009-2012’s Double Bottom pattern.
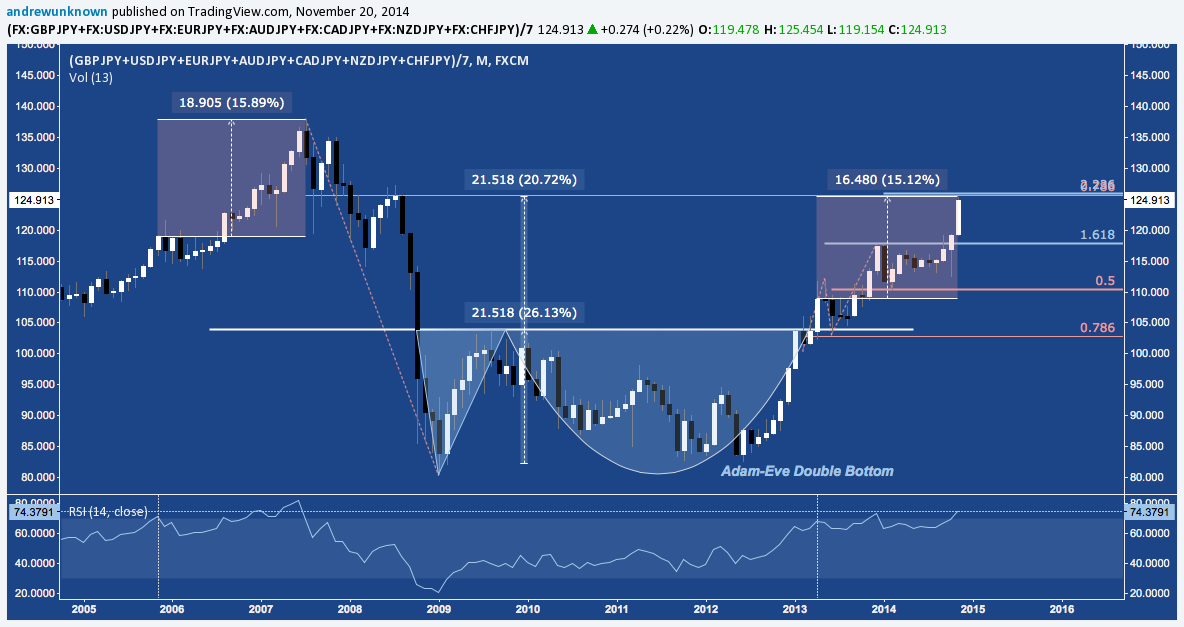
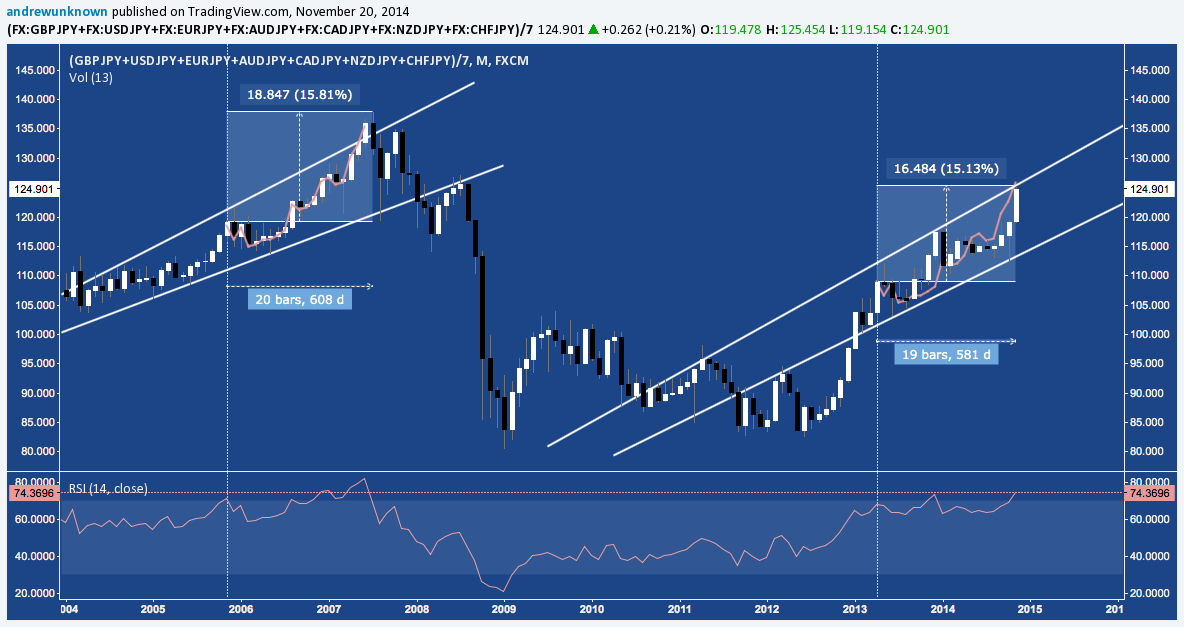
Not only is the short JPY trade at fibonacci and measured move resistance, it’s also at Rising Broadening Wedge trend resistance and heavily overbought, oscillating around an RSI of 70 for over 18 months. The escalating up-trend calls to mind 2006-2007’s range, duration and momentum oscillations – not unlike a similar analog on US equities nearing it’s culmination.
Assurances are nearly universal wherever you look that the Yen will continue sailing off the cliff the Bank of Japan shoved it over in early 2013 (adding it’s latest push just 3 weeks ago). But even debasing one’s currency at a rate of 15% GDP per year isn’t an entirely linear process. To wit, Abe conceded on October 7 the weak Yen is harming small businesses and households as it does everything from devalue inventories to chew away at real wages. JPY has declined 9.2% against the USD since, screwing the vice much tighter on Japan economy to a degree that negative for both import and export sides of the GDP ledger.
An increasingly urgent but almost entirely unappreciated dilemma emerges: how far can the market push before Abe and Kuroda are compelled to push back?
Trade ‘Em Well.
Twitter: @andrewunknown
Kassen holds no exposure to securities/instruments mentioned at the time of publication. Commentary provided above is for educational purposes only and in no way constitutes trading or investment advice.


